

Manuscript accepted on :
Published online on: 18-12-2015
Azadirachta Indica as a Source For Antioxidant and Cytotoxic Polyphenolic Compounds
Ammar Bader1, Mohamed I. S. Abdelhady1,3*, Usama Shaheen1,4, Yasser El-Malah2,5, M.A.S Abourehab2,6, Mohamed F. Barghash7
1Departments of 1Pharmacognosy, Umm Al-Qura University, Makkah 21955, Saudi Arabia. 2Pharmaceutics, Faculty of Pharmacy, Umm Al-Qura University, Makkah 21955, Saudi Arabia. 3Department of Pharmacognosy, Faculty of Pharmacy, Helwan University, Cairo 11795, Egypt 4Department of Pharmacognosy, Faculty of Pharmacy, Al-Azhar University, Cairo, Egypt 5Department of Pharmaceutics, College of Pharmacy, Mansoura University, Mansoura, Egypt 6Pharmaceutics Department, Faculty of Pharmacy, Minia Universuty, Egypt. 7Biochemistry Department, Genetic Engineering and Biotechnology Division, NRC, Cairo, Egypt
ABSTRACT: Cancer is a life threatening malignant tumor, caused by many factors including the oxidative stress. Medicinal plants containing phenolic compounds represent an important source of antioxidant and anticancer drugs. Azadirachta indica Family: Meliaceae contains variety of bioactive components of numerous biological and pharmacological properties. This study explored the constitutive polyphenols of Azadirachta indica (A. indica) growing in KSA and evaluated its antioxidant and cytotoxic activity. Chemical structures of the isolated compounds from the leaves of A. indica were established by spectral techniques (UV, MS, 1H, and 13C NMR, and two dimentional NMR). The colourimetric assay (SRB) used to evaluate the cytotoxicity against HCT116, MCF7 and Hep-G2 cell lines. Chromatographic separation of 80% Ethanol extract of the leaves of A. indica have resulted in seven polyphenolic compounds three of them isolated for the first time from this species (2,3-(S)-hexahydroxydiphenoyl-(α/β)-D-glucopyranose, Avicularin and Castalagin) and four known previously isolated compounds (Gallic acid, Ellagic acid, Quercetin and Quercetin-3-O-glucoside). The 80% Ethanol extract exhibited higher antioxidant activity than the ethyl acetate and butanol extracts, which is correlated with its phenolic content. The ethanolic extract, compounds 4 and 6 exhibited cytotoxic activity against HCT116, MCF7 and Hep-G2. These findings revealed that the leaves of A. indica contains a considerable amount of polyphenolic compounds with significant antioxidant and cytotoxic activity, consequently it could be considered as a great potential source for natural health products.
KEYWORDS: Neem; polyphenolic compounds; cytotoxic; antioxidant activities
Download this article as:| Copy the following to cite this article: Bader A, Abdelhady M. I. S, Shaheen U, El-Malah Y, Abourehab M. A. S, Barghash M. F. Azadirachta Indica as a Source for Antioxidant and Cytotoxic Polyphenolic Compounds. Biosci Biotech Res Asia 2015;12(2) |
Introduction
Neem (Azadirachta indica A. Juss.), a member of the Meliaceae family, is a fast growing tropical evergreen tree. The neem tree (A. indica) is native to the Indian subcontinent and grows in many countries of the world like Egypt and Kingdom of Saudi Arabia (KSA). A massive cultivation of this tree was occurred in the plains of Arafat, Makkah Almokaramah, KSA. In 1971, Approximately 50,000 Neem trees were cultivated to provide shade for the millions of Muslim pilgrims (Maridha and Suhaibani, 2014). A. indica contains various active constituents with several medicinal properties. It used for treatment of fever, diabetes, and disorders that relate to arthritis and rheumatism, skin diseases and inflammation. It was practiced by different type of vaidyas and traditional healer in almost all the countries in the world, like KSA, China, India, Egypt, Rome and Greek and its proximity with human culture, hence neem has been called “nature’s drug store” and “the wonder tree”. (Dholi et al., 2011; Sonia Bajaj, and Srinivasan B.P 1999; El-Mahmood et al., 2010; Maragathavalli et al., 2012; Amer et al., 2010; Van der Nat et al., 1991; Chatterjee and Pakrashi 1994; Shibata, 1955; Clayton et al., 1996; Van der Nat et al., 1991; Chopra et al., 1956; Murthy and Sirsi, 1958; Patel et al., 2011; Bailey, 1953; Engler, 1964; Chopra et al., 1958; Koul et al., 1990; Haque et al., 2006; Habila et al., 2011; Sharma and Bhattacharyya, 2005; Bandyopadhyay et al., 2002; Sathiyaraj et al., 2010; Boadu et al., 2011; Patel et al., 2011; Kirtikar and Basu, 1975; Bansal et al., 2010; Santra and Manna , 2009; Denardi et al., 2010; Baral and Chattopadhyay, 2004; Habila et al., 2011; Schmutterer, 1995).
From the above mentioned information, it was concluded that A. indica have various pharmacological activities and used in the various marketed formulation, so it is necessary to throw a light on the phenolic contents and biological activities of A. indica growing in KSA
Materials and methods
Instruments and materials
NMR (1H- and 13C NMR) spectra were recorded at 300 MHz for 1H and 75 MHz for 13C on a Varian Mercury 300. The δ-values are reported as ppm relative to TMS (tetramethyl silane) in DMSO-d6 and J-values recorded in Hz. ESI-MS spectra were measured using mass spectrometer connected to an ESI-II ion source (Finnigan, Lc-MSLCQdeca. Advantage MAX, Finnigan Surveyor LC pump) (Department of Biological Genetics, National Research Center, Cairo, Egypt), the analysis was performed by the help of Dr. Amel Kamal, faculty of pharmacy, Helwan university, cairo, Egypt and as illustrated in previous study (Haggag et al., 2011). Purity of sample were recorded on a Shimadzu UV 240 spectrophotometer, separately as solutions in methanol and diagnosed by different UV shift reagents (Mabry et al., 1970) and with sprayed Naturstoff reagent (Brasseur & Angenot, 1986).
Chemicals
DPPH (1,1-diphenyl-2-picrylhydrazyl) was purchased from Sigma-Aldrich Co. (St Louis, MO). Sodium phosphate, ammonium molybdate, Folin-Ciocalteu’s reagent, ascorbic acid, gallic acid were purchased from Merck Chemical Co (Darmstadt, Germany). All other chemicals, solvents and reagents used in chromatography were of analytical grade.
Cell line and culture medium
HCT116 and MCF7 and Hep-G2 cells were preserved in RPMI-1640 medium containing 10% (v/v) heat inactivated fetal bovine serum supplemented mixture of 100 μg/ml streptomycin and 100 U/ml penicillin at 37°C under 5% CO2 in air.
Preliminary Phytochemical Screening
Phytochemical screening methods were used for detection of various phytochemicals by qualitative chemical tests to give general idea regarding the nature of constituents present in crude drug (Trease and Evanse 1996; Parekh J and Chanda SV, 2007).
Determination of total phenolic content
The total phenolic content of 80% EtOH, EtOAc, n-BuOH extracts of A. indica was determined using Folin-Ciocalteu reagent according to the method described by Kumar et al. (2008). Gallic acid was used as standard. All determinations were carried out in triplicate. The total phenolic content was expressed as mg gallic acid equivalent (GAE)/g extract.
Determination of total flavonoid content
The total flavonoid content of 80% EtOH, EtOAc, n-BuOH extracts of A. indica was determined using the procedure described by Kumaran and Karunakaran (2006) using Quercetin as a standard. All determinations were carried out in triplicate. The total flavonoid in each plant extract was determined as mg quercetin equivalents (QEs)/g extract.
DPPH radical scavenging activity
The ability of 80% EtOH, EtOAc, n-BuOH extracts of A. indica to scavenge DPPH radicals was evaluated according to the procedure described by Mensor et al. (2001).
Reducing power assay
Reducing power of 80% EtOH extract of A. indica as well as two of the isolated pure compounds (4&6) was determined according to the method of Oyaizu (1986) using ascorbic acid as standard. Three replicates were made for each tested sample. Increased absorbance of the reaction mixture indicated increased reduction power.
Cytotoxic assay
The cytotoxic activity of 80% EtOH extract of A. indica as well as the isolated pure compounds 4 and 6 was carried out according to the method described by Skehan et al. (1990) using colourimetric assay (SRB) and as described in our previous study (Haggag et al., 2011). The IC50 values were calculated from the prism program obtained by plotting the percentage of surviving cells vs. the concentration interpolated by cubic spine (Boyed, 1997).
Plant material
Leaves samples of neem (Azadirachta indica) were freshly collected from Bahra in KSA. The samples were collected in November 2011.
Extraction and Isolation
Air-dried ground leaves (1000 g) were extracted with hot 80% aqueous ethanol (2.5×5L) under reflux (70°C). After evaporation of solvent under reduced vacuum, the residue (115 g) was defatted with pet.ether (60-80°C) under reflux (1.5 L×5L. 60°C). The residue (110 g) after evaporation of pet.ether was fractionated on a polyamide column (Ø 5.5×120 cm) and was eluted water/methanol mixtures of decreasing polarities to afford 25 fractions. Those fractions were concentrated under vacuum and purified on Sephadex LH-20 column and or Cellulose columnsusing different eluting systems. The homogenity of the fractions was tested on 2D-PC and Comp-PC using Whatmann No. 1 paper (systems S1 & S2); S1: n-BuOH-HOAc-H2O (4:1:5, top layer) and S2: 15% aqueous HOAc. The compounds were visualized by spraying with naturstoff (flavonoids) and nitrous acid or KIO3-reagents (tannins).
Data analysis
All values in this study are expressed as mean ± standard deviation of the mean (M+SD). Data were analyzed by one-way analysis of variance (ANOVA). When variation among groups was found significant, Tukey-Kramer multiple comparisons test was carried out to compare between groups. Differences were considered significant when p value was < 0.05.
Results
Phytochemical Screening
Phytochemical screening tests for A. indica leves extract resulted in detection of alkaloids, flavonoids, reducing sugars, steroids, carbohydrates, glycosides and tannins, while Anthraquinones and cardiac glycosides were not detected from the extract.
Total phenolic, flavonoid content and antioxidant activities
Phenolic Content of the Extracts
Ethanolic (80%), Ethyl acetate and butanol extracts from the leaves of A. indica were standardized for their contents of phenolic compounds. As shown in Figure 1 The calibration curve showed linearity for gallic acid in the range of 12.5-400 μg·ml–1, with R2 (correlation coefficient) of 0.999. Ethanolic contained the highest content of phenolics (69.17 ±1.57 mg·g–1), followed by ethyl acetate extract (38.13 ± 1.25 mg·g–1) and Butanol extract (24.38 ± 3.13 mg·g–1).
Flavonoid content of extracts
Ethanolic (80%), Ethyl acetate and butanol extracts from the leaves of A. indica were standardized for their contents of phenolic compounds. The calibration curve showed linearity for Quercetin in the range of 12.5-100 μg·ml–1, with a correlation coefficient (R2) of 0.999 (Figure 2). Ethanolic contained the highest content of flavonoids (42.435±0.8 mg·g–1), followed by ethyl acetate extract (25.256±0.89 mg·g–1) and Butanol extract (14.87±1.35 mg·g–1).
Antioxidant Activity of the Extracts
The standardized ethanolic, ethyl acetate, butanol extracts and gallic acid as +ve control were assessed for their capacity to scavenge DDPH free radical. The antioxidant activity data are written as percentage of free radical inhibition in Table 1. The ethanolic (80%) extract of of A. indica levaes exhibited pronounced antioxidant activity at a concentration of 12.5-100 μg·ml–1, followed by ethyl acetate and butanol extracts when compared by ascorbic acid as standard. Natural polyphenolic compounds are known to have chemopreventive and suppressive activities against cancer cells by inhibition of metabolic enzymes involved in the activation of potential carcinogens or arresting the cell cycle [Newman et al., 2002]. Nevertheless, a compound with strong free radical scavenger activity can also contribute to DNA protection and prevent apoptosis [Rajkumar et al., 2011]. Further studies are therefore required to detect potential anticancer activities of the extracts reported here. So it was interesting to isolate and identify polyphenolic compounds from the highest antioxidant extract i.e. ethanolic extract which contains also the highest contents of phenolic and flavonoidal contents and estimate their reducing powers and their cytotoxic activity.
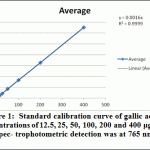 |
Figure 1: Standard calibration curve of gallic acid at concentrations of 12.5, 25, 50, 100, 200 and 400 μg·ml–1. Spec- trophotometric detection was at 765 nm |
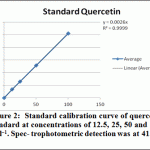 |
Figure 2: Standard calibration curve of quercetin standard at concentrations of 12.5, 25, 50 and 100 μg·ml–1. Spec- trophotometric detection was at 415 nm |
Table 1: percentage of DPPH radical scavenging activity of A. indica extracts.
| μg/ml | Ascorbic acid (Mean ±SD) | Aqu. Ethanol ext. (Mean ±SD) | Ethyl acetate ext. (Mean ±SD) | Butanol ext. (Mean ±SD) |
| 12.5 | 28.595± 0.254 | 13.306±0.8 | 10.69±0.63 | 6.995±0.733 |
| 25 | 37.03±0.407 | 25.638±1.924 | 20.23±0.455 | 15.524±2.584 |
| 50 | 54.267±0.21 | 41.331±0.613 | 36.69±1.552 | 17.843±2.083 |
| 100 | 87.433±0.354 | 55.074±1.434 | 47.82±2.437 | 29.234±1.749 |
Identification of Phenolics isolated from A. indica
Compound 1
Yellowish white amorphous powder (20 mg). Chromatographic properties, Rf values: 0.65 (S1), 0.50 (S2); shiny violet fluorescent under UV-light turned to deep blue color with FeCl3 spray reagent. This evidence was supported by the comparison with respective authentic samples and confirmed by Mass analysis. Negative HRESI-MS, 169.08[M-H]–.
Compound 2
Off white amorphous powder (18 mg). Chromatographic properties: Rf-values 0.41 (S1), 0.20 (S2); UV/response with spray reagents: buff fluorescent spot by long and short UV light, turned to dull yellow fluorescence on exposure to ammonia vapours, greenish yellow (naturstoff), faint indigo-red colour (nitrous acid reagent) and faint blue colour (FeCl3). UV λmax (MeOH), nm: 216, 257, 363. Negative HRESI-MS, 300.9 [M-H]–.
Compound 3
Isolated as yellow amorphous powder (9 mg), gave chromatographic properties, UV spectral data and responses towards spray reagents similar to Quercetin. This evidence was supported by the comparison with respective authentic samples and confirmed by Mass analysis. Negative HRESI-MS: m/z, 301.04 [M-H]–.
Compound 4
Brown amorphous powder (36 mg). Chromatographic properties: Rf-values on PC; 0.1(S1), 0.67 (S2); UV/response with spray reagents: dark purple fluorescent spot by short UV-light and dull brown under long UV-light, turned to indigo red (NaNO2/glacial AcOH) and deep blue colour (FeCl3). UV λmax (MeOH), nm: 248, 289 sh, 300. -ve HRESI-MS: m/z 933.067[M-H]–, (MS2) 914.89[M-H-H2O]–, 631.063[M-H-ellagic acid]–, (MS3) 896.95[M-H-2H2O]–, (MS4) 878.96[M-H-3H2O]–, 301.08[Ellagic acid-H]–. 1H NMR:δ ppm 6.59(1H, s, H3“` FLG), 6.52 (1H, s, H3““ HHDP), 6.37 (1H, s, H3““` HHDP), 5.48(1H, d, J=5.6 Hz, H1), 5.42(1H, br d, J=8.1 Hz, H5), 4.94(1H, t-like, J = 8.1 Hz, H4), 4.9(1H, dd, J=11.8, 3 Hz, H6), 4.79(2H, m, H3/2), 3.98(1H, br d, J=11.8 Hz, H6`). 1H, 1H-COSY spectrum, Short range coupling HMQC spectrum, Long range coupling HMBC spectrum. 13C NMR: δ ppm 169.14, 165.21, 165.86, 165.80, 162.87(C7““/C7““`HHDP, C7“`/C7“/C7`FLG), 146.67, 144.91, 144.85, 144.73, 144.46(C4“`FLG, C6““/6““`/4““/4““` HHDP, 4`/4“FLG), 144.12, 143.72, 142.47(C6`/6“/6“`FLG), 136.98, 135.80, 135.58(C5“`FLG, C5““/5““`HHDP), 135.10(C5“ FLG), 133.26(C5“` FLG), 125.90(C2“ FLG), 124.79, 123.52(C2““/2““`HHDP), 123.43(C2“` FLG), 121.14(C2` FLG), 115.26, 114.59, 114.47, 114.36, 114.3(C1`/1“/1“`FLG, C1““/1““`HHDP and C3`FLG), 111.69(C3“FLG), 106.73, 105.66, 105.59(C3“`FLG, C3““/3““`HHDP), 72.69(C2), 69.79(C5), 68.07(C4), 66.12(C1), 65.74(C3), 65.58(C6).
Compound 5
Brownish amorphous powder (16 mg). Chromatographic properties: Rf-values on PC; 0.21 (S1), 0.9 (S2); UV/response with spray reagents: dark purple fluorescent spot by short UV-light, turned to indigo-red (NaNO2-glacial AcOH) and deep blue colour (FeCl3). UV λmax (MeOH), nm: 246 with 286 sh and 300. Negative ESI-MS/MS: m/z 481.31[M-H]–, (MS2) 301.19[Ellagic acid-H]–, (MS3) 257.08[Ellagic acid-H-CO2]–, 229.26[Ellagic acid-H-CO2-CO]–. 1H NMR: δ ppm 6.42(1H, s, H3“), 6.19(1H, s, H3`), 5.17 and 4.84(1/2H, s, H1α and β), 5.13 and 4.88(1H, t-like, J=10 Hz, H3α and β), 4.70 and 4.50(1H, d, J=10 Hz, H2α and β ), 3.72-2.72(broad band, hidden by H2O-signal represents remaining sugar protons). 13C NMR: δ ppm 169.24(C7“α,β), 168.63, 168.40(C7`α,β), 144.49(C6`/6“α,β), 144.42(C4`/4“α,β), 134.97, 134.85(C5`/5“α,β), 125.48, 125.29 , 124.89(C2“α,β/ C2`α,β), 113.79, 113.71, 113.67, 113.51(C1“α,β/ C1`α,β), 105.30, 104.95(C3`/3“α,β), 92.88, 88.97(C1β/ C1α), 79.61(C3α), 77.27(C3β), 76.95, 76.77(C2α/2β), 74.24(C4β), 72.17(C5α), 67.24(C4α), 66.89(C5β), 61.03(C6α,β).
Compound 6
Yellow amorphous powder (37 mg). Chromatographic properties: Rf-values 0.41 (S1), 0.49 (S2); UV/response with spray reagents: deep purple fluorescent spot by long UV light turned to orange (naturstoff), green (FeCl3). UV λmax: (MeOH), nm: 260, 297(sh), 352; (+NaOMe) 271, 329(sh), 404; (+NaOAc) 272, 318 (sh), 362; (+NaOAc/H3BO3) 271, 402; (+AlCl3) 272, 303 (sh), 337(sh), 422; (+AlCl3/HCl) 267, 300(sh), 362 (sh), 400. Negative HRESI-MS: m/z 433.08[M-H]–, 867.32[2M-H]–, 300.15[M-pentoside]–=[quercetin-H]–, -Ve ESI-MS: m/z 301.05[quercetin-H]–, 179.00(C9H7O4, cinnamoyl fragment), 151.00(C6H3O4, benzoyl fragment) (MS3). 1H NMR: δ ppm 12.63(1H, s, OH5), 7.57(1H, m, Hz, H6`), 7.48(1H, d, J = 2.3 Hz, H2`), 6.86(1H, d, J= 8.4 Hz, H5`), 6.41(1H, d, J = 2.3 Hz, H8), 6.21(1H, d, J=2.3 Hz, H6), 5.58(1H, d, J = 1.4 Hz, H1“), 4.17-3.24(remaining sugar protons). 13C NMR: δ ppm 177.56(C4), 164.15(C7), 161.18(C5), 156.95(C2), 156.43(C9), 148.53(C4`), 145.04(C3`), 133.21(C3), 121.77(C1`), 121.01(C6`), 115.54(C2`/5`), 108.04(C1“), 104.01(C10), 99.03(C6), 93.572(C8), 85.57(C4“), 82.08(C2“), 77.03(C3“), 60.65(C5“).
Compound 7
Yellowish amorphous powder (17 mg). Chromatographic properties: Rf-values 0.47 (S1), 0.60 (S2); UV/response with spray reagents: deep purple fluorescent spot by long UV light turned to yellowish orange (naturstoff), and green by FeCl3. UV λmax: (MeOH), nm: 259, 355; (+NaOMe) 273, 412; (+NaOAc) 266, 373; (+NaOAc/H3BO3) 261, 375; (+AlCl3) 250 (sh), 250, 271, 405; (+AlCl3/HCl) 250 (sh), 262, 271, 362. -Ve HRESI-MS: m/z 463.1[M-H]–, 301.1[M-hexoside]–=[quercetin-H]–, (MS3) 178.9(C9H7O4 represent cinnamoyl fragment), 150.9(C6H3O4 represent benzoyl fragment). 1H NMR: δ ppm 12.61(1H, s, OH5), 7.67(1H, m, H6`), 7.59(1H, d, J=2.4 Hz, H2`), 6.84(1H, d, J= 8.7 Hz, H5`), 6.41(1H, d, J=3 Hz, H8), 6.21(1H, d, J=3 Hz, H6), 5.37 (1H, d, J=8Hz, H1“), 3.67-3.26 (remaining sugar protons). 13C NMR: δ ppm 177.33(C-4), 164.28(C-7), 161.19(C-5), 156.30(C-2), 156.26(C9), 148.43(C4`), 144.78(C3`), 133.51(C3), 121.23(C1`), 121.08(C6`), 115.80(C5`), 115.19(C2`), 104.01(C10), 101.19(C1“), 98.51(C6), 93.68(C8), 73.8(C3“), 73.32(C5“), 71.25(C2“), 67.53(C4“), 60.30(C6“).
Reducing power
Compounds 4 and 6 represents the major comounds have been solated from the extract so it was be interesting to evaluate their reducing power in comparison with the ethanol extract. Compound 4 exhibited highest activity followed by compound 6, then the ethanolic extract (Table 2), when compared to ascorbic acid as standard. Based on the obtained data, it is interesting to carry out the cytotoxic assay.
Table 2: Reducing power assay for ethanolic extract and isolated compound 4 and 6 of A. indica
| Ug/ml | Ascorbic acid
(Mean ±SD) |
Ethanol extract
(Mean ±SD) |
castalagin
(Mean ±SD) |
Avicularin
(Mean ±SD) |
| 25 | 0.432±0.003 | 0.167±0.01 | 0.279±0.007 | 0.237±0.014 |
| 50 | 0.612±0.002 | 0.309±0.009 | 0.425±0.008 | 0.385±0.008 |
| 100 | 0.942±0.003 | 0.427±0.012 | 0.784±0.006 | 0.723±0.007 |
Cytotoxic activity
Significant antioxidant and reducing power activity of the ethanolic extract and compound 4 and 6 directed us to test their cytotoxic activity against certain cell lines such as MCF7, Hep-G2 and HCT116 using the SRB method (Skehan et al., 1990). The ethanolic extract exhibited cytotoxic activity against HCT116, MCF7 and Hep-G2 (IC50 value 72.29, 61.86 and 128.7μg/ ml respectively). Compound 4 was the most active compound (IC50 =20.38, 42.52 and 86.75 μg/ml respectively). Compound 6 exhibited cytotoxic activity (IC50=39.25, 47.28 and 99.24 μg/ml, respectively). Accordingly, compound 4 is the most active followed by the compound 6 and finally the ethanolic extract.
Discussion and conclusion
Phytochemical screening for active substances of A. indica resulted in detection various compounds such as glycosides, tannins, alkaloids, flavonoids, reducing sugars, steroids and carbohydrates, while anthraquinones and cardiac glycosides were absent from the extract, which are in accordance with previous studies (Imran et al., 2010; Ejoba, 2012). It is well known that there is a strong relationship between phenolic content of plants and the antioxidant activity, as phenols possess strong scavenging activity for free radicals due to their phenolic hydroxyl groups (Wojdylo et al., 2007; Bendini et al., 2006; Dlugosz et al., 2006 Yildirim et al., 2000; Mohamed et al., 2008; Singh et al., 2009). This study also proved that the extracts of neem (i.e. ethanolic extract, ethyl acetate and butanol extracts) have significant free radical scavenging activity. This may be attributed to their polyphenolic and flavonoidal contents where ethanol extract of the neem showed the highest DPPH inhibition activity followed by ethyl acetate extract then butanol extract and that was parallel to their phenolic and flavonoidal contents (Figures 3 and 4). Owing to the high antioxidant activity of 80% EtOH extract (Fig. 5), it was subjected to chromatographic fractionation.
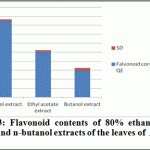 |
Figure 3: Flavonoid contents of 80% ethanol, ethyl acetate and n-butanol extracts of the leaves of A. indica ( n =3) |
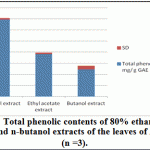 |
Figure 4: Total phenolic contents of 80% ethanol, ethyl acetate and n-butanol extracts of the leaves of A. indica (n =3) |
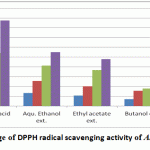 |
Figure 5: Percentage of DPPH radical scavenging activity of A. indica extracts |
The dried residue of 80% EtOH extract, which was extracted with chloroform for defatting and extracting of aglycones (Marzouk et al., 2009) was chromatographed on a polyamide column followed by successive purification on Sephadex LH-20 and/or cellulose columns getting seven pure compounds, among which was compound 1, which show chromatographic properties of gallic acid, This evidence was supported by the comparison with respective authentic samples and confirmed by Mass analysis. Negative HRESI-MS, 169.08[M-H]–. Resulted in Gallic acid (compound 1) which isolated before from A. indica. (Singh et al., 2005). Compound 2, this compound gave more or less the same chromatographic properties (Rf-values, colour and fluorescence changes on exposure to ammonia vapours and with the different spray reagents) of the ellagic acid authentic sample. Based on its intrinsic δ-electronic conjugation over the total C-skeleton, it showed the characteristic UV-absorption bands of ellagic acid (Tanaka et al., 1986 a and b). Negative HRESI-MS of compound 2 exhibited a molecular ion peak at m/z 300.9 [M-H]–, that corresponding to the MF C14H5O8 of ellagic acid. Accordingly, compound 2 was established as ellagic acid (Tanaka et al., 1985), which is isolated before from A. indica (Garima et al., 2014). Compond 3, UV spectral data and responses towards spray reagents similar to Quercetin. This evidence was supported by the comparison with respective authentic samples and confirmed by Mass analysis. Negative HRESI-MS: m/z, 301.04 [M-H]–. Accordingly, this compound was established as quercetin. (Mabry et al., 1970). Which isolated before from A. indica (Garima et al., 2014). Compound 4 showed more or less the same chromatographic behavior of C-glycosidic ellagitannin. It exhibited also, very broad strong UV absorption maxima with the characteristic shoulder at 289 nm. Upon acid hydrolysis it gave ellagic acid in the organic phase and an unknown ellagitannin. The absence of the glucose in the aqueous hydrolysate was a confirmative evidence for the C-glycosidic nature of Compound 4 (Okuda et al, 1983). -Ve HRESI-MS spectrum showed a molecular ion peak at m/z 933.067 [M-H]– representing C41H25O26. At high fragmentation energy MS/MS spectra, several diagnostic fragment ions were recorded; the most important ones are at 631.063 and 301.08 corresponding to the loss of a HHDP moiety and the negative ellagic acid ion, which was indirect indication for the other C-glycosidic phenoyl moiety as flavogallonoyl. The 1H NMR spectrum exhibited three singlets, each one proton assigned at δ 6.59, 6.52 and 6.37 ppm for a C-glycosidic flavogallonoyl attached to C-1, C-2, C-3 and C-5 and HHDP at C-4 and C-6 of open chain glucose. The δ– and J-values of the glucose moiety, especially that of H-1 at δ 5.48 with J12 of 5.6 Hz, were confirmative for full substituted open glucose with anomeric axial OH-group (Vivas et al, 1995; Okuda et al, 1983; Moharram et al, 2003). Like in the previous C-glycosidic ellagitannin, 13C NMR spectrum showed 6 upfield typical carbon resonances of a C-glycosidic glucose and 14 resonances of a HHDP moiety together with 21 of flavogallonoyl forming C-glycosidic linkage with C-1 glucose. Characteristic downfield shift of C-3` at δ 114.3 (≈+10 ppm) and upfield shift of the carbonyl carbon C-7` at 162.87 (≈-7 ppm) of the flavogallonoyl moiety. The δ– and J12– values of H-1 glucose proved that the absolute configuration at the anomeric position should be of axial OH and equatorial H, which was completely, agree with those of castalagin (Vivas et al., 1995; Okuda et al., 1983 and Moharram et al, 2003). All assigned 1H and 13C signals were confirmed by 2D NMR spectral analysis. Accordingly, Compound 4 was finally identified as 2,3,5-(S)-flavogalonoyl-4,6-(S)-hexahydroxydiphenoyl-D-glucose (Castalagin) (figure 6), (Vivas et al., 1995). Compound 4, was isolated for the first time from A. indica leaves. Compound 5 appeared as deep purple fluorescent spot by short UV-light changed into deep blue colour with FeCl3 and indigo-red colour with HNO2 spray reagent characteristic for hexahydroxydiphenoyl esters (ellagitannins), (Gupta et al., 1982). The UV-spectrum showed intrinsic broad absorption band with a shoulder at λmax 286 nm characteristic for the ellagitannins. On complete acid hydrolysis, compound 5 gave ellagic acid in the organic phase and glucose in the aqueous one (CoPC with authentic phenolic acid and sugars samples). Accordingly, it was expected that the structure of compound 5 is a hexahydroxydiphenoyl ester of glucose. The -ve ESI-MS spectra gave a molecular ion peak at m/z 481.31[M-H]– corresponding to a mono-hexahydroxydiphenoyl-glucose. In addition at high fragmentation energy, three ellagic acid fragment ions have been detected at 301.19 [Ellagic acid-H]– (MS2), 257.08 [Ellagic acid-H-CO2]–, 229.26 [Ellagic acid-H-CO2-CO]– (MS3) in MS/MS spectra. These fragments were confirmative for the presence of a hexahydroxydiphenoyl group (HHDP). The positions of the attachment of HHDP onto glucose and its stereochemistry were concluded from NMR analysis. 1H NMR exhibited two singlet signals, each one proton, at δ ppm 6.42 and 6.19 of one HHDP group (H-3”, 3′). In the aliphatic region, duplication of all assigned 1H-resonances was indicative to a free anomeric-OH and the presence of compound 5 in the form of α/β-anomers (Okuda et al., 1989). The downfield assignment of H-3 and H-2 in both anomers at 5.13, 4.88 (3α/β) and 4.70, 4.50 (2α/β) indicated the attachment of the HHDP-group at C-2 and C-3. As well as, the large J-values (9-10.1Hz) for all sugar signals together with H-1α and H-1β at 5.17 and 4.84 (J = 8.3 Hz) were confirmative evidences for an α/β–4C1-pyranose structure of the glucose moiety (Gupta et al., 1982, Okuda et al., 1983). Therefore, compound 5 was identified as 2,3-hexahydroxydiphenoyl-(α/β)-D-4C1-glucopyranose. The 13C NMR spectrum showed also the duplication of all aliphatic and aromatic signals to confirm the α/β-configuration of the glucose, especially those of the anomeric carbon at 92.88 and 88.97 for C-1α and C-1β. The remaining 13C-signals were assigned by the comparison with published data of structural similar compounds (Okuda et al., 1982). Thus, compound 5 was confirmed as 2, 3-(S)-hexahydroxydiphenoyl-(α/β)-D-glucopyranose (figure 6). This isolated for the first time in A. indica leaves.
On the basis of its chromatographic properties and UV spectral data, compound 6 was suggested to be quercetin-3-O-glycoside. UV-spectrum in MeOH showed the two characteristic bands for a quercetin aglycone. The presence of a free 4`-OH group was deduced from the bathochromic shift in band I (+52 nm) with the increase in the intensity (Mabry et al, 1970). On addition of NaOAc, a bathochromic shift in band II (~+10 nm) was an evidence for a free 7-OH. Moreover, the remaining of the bathochromic shifts occurred in band I and II on both NaOAc and AlCl3 spectra after the addition of H3BO3 and HCl revealed the ortho 3`,4`-dihydroxy-function and the free OH-5. Complete acid hydrolysis produced quercetin in organic phase and arabinose in aqueous phase. -Ve HRESI-MS spectrum exhibited a molecular ion peak at m/z 433.08, corresponding to MF C20H18O11 for a quercetin pentoside. As well as, this evidence was further supported by the fragment ions at m/z 301.05, 179.00 and 151.00. The 1H NMR, showed in the aromatic region the two characteristic spin coupling systems i.e. ABX (H-2`d, H-6` dd, H-5`d) and AM (H-8 d; H-6 d) for 3`,4`-dihydroxy B- and 5,7-dihydroxy A- ring protons. In the aliphatic region, a doublet at 5.58 with J12 =1.4 Hz was characteristic for α-L-arabinofuranoside moiety (Servettaz, 1984) with the other sugar protons. 13C NMR spectrum showed 15 carbon resonances among which the key signals at δ 177.56 (C-4), 148.53 (C-4`), 145.04 (C-3`) and 133.21 (C-3) for a 3-O-glycosyl-quercetin (Agrawal, 1989). In addition, five highly strained and downfield shifted 13C resonances particulary those at 108.04, 85.57 and 82.08 assignable to C-1“, C-4“ and C-2“ of an arabinofuranoside moiety (Agrawal, 1989). So Compound 6 was identified as quercetin3-O-α-L-arabinofuranoside (Avicularin) (figure 6), which is isolated for the first time from A. indica leaves.
Like compound 6, Compound 7 had chromatographic properties and UV spectral data of a quercetin-3-O-glycoside. As in case of compound 6, the bathochromic shift with increase in the intensity of band I upon addition of NaOMe was confirmative to a free 4`-OH. This evidence was also deduced from the remaining of the bathochromic shifts recorded in both NaOAc and AlCl3 spectra after the addition of H3BO3 and HCl. Acid hydrolysis of compound 7 afforded quercetin as an
aglycone and galactose as sugar moiety, were identified by CoPC in different convenient solvent systems (Mabry, 1970). Negative HRESI-MS spectrum showed a molecular ion peak at m/z 463.09 corresponding to molecular formula (MF) C21H20O12 of a quercetin hexoside, together with other fragment ion peaks at 301.02, 178.9 and 150.9 confirming the presence of the quercetin as an aglycone. 1H NMR, showed in its aromatic region two characteristic spin coupling systems. ABX system was recorded as a doublet of doublet at 7.67, a meta doublet at 7.59 and an ortho doublet of one proton at 6.84, which were assignable to H-6`, 2` and 5` of 3`, 4`- dihydroxy B-ring. The AM system was recorded as meta-coupled doublets at 6.41 and 6.21 for H-8 and H-6 of 5, 7-dihydroxy A-ring, respectively (Harborne, 1984). 13C NMR spectra showed more or less the same 15 carbon resonances of a quercetin-3-O-glycoside, which were assigned in case of the previous compound 6. The sugar moiety was finally proved to be glucoside in a β–4C1-pyranose stereostructure due to its typical six signals, particularly those of C-5“ and C-3“, which have a difference less than 1 ppm (Agrawal, 1989). Thus, compound 7 was identified as quercetin 3-O–β-D-4C1-glucopyranoside (figure 6), which is isolated before from A. indica (Monirul et al., 2012; Chakroborty et al., 1989; Babu et al., 2008).
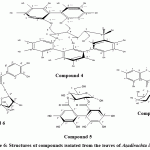 |
Figure 6: Structures of compounds isolated from the leaves of Azadirachta indica |
EtOH extract and the major isolated compounds (i.e. compound 4 and comound 6) evaluated as reducing power activity. In this assay, the ability of 80% EtOH extract, compound 4 and compound 6 of the leaves of A. indica to reduce ferric to ferrous was evaluated at 700 nm. From Figure 7, it is evident that the tested samples have reducing power. Higher absorbance at 700 nm corresponds to higher reducing power. When compared the reducing power of the extracts to standard reference (ascorbic acid), it was appeared that the 80% EtOH extract, compound 4 and compound 6 exhibited significant reducing power.
Recent studies prove that the efficacy of chemotherapeutic agents can be enhanced and lower their toxicity to normal tissues when combined with plant derived chemopreventive agents to prevent the action of generation of free radicals (Silici et al., 2011; Takaki-Doi et al., 2009). In our study neem exhibited significant cytotoxic activity against the tested cell lines and its extract has high antioxidant activity and that was supported by the previous reported data where Neem is one of those candidate plants which have chemoprotective effect and strong antioxidant potential (Sithisarn, et al., 2005; Chattopadhyay, 2003; Biswas et al., 2002). Castalagin (compound 4), avicularin (compound 6) and ethanolic extract exhibited significant cytotoxic activity against the tested cell lines (Figures 8, 9 and 10). Castalagin represents an important compound where it supressed human promyelocytic leukemia cell line HL-60 (Yang et al., 2000). Castalagin exhibited marvelous cytotoxic activity against colorectal carcinoma (HCT116 SC50= 20.38 μg/ml). As Colorectal cancer (CRC) ranks first and third in males and females, respectively among all cancers in Saudi Arabia (KSA) and high incidence of rectal cancer in Egypt [Abdul et al., 2011; Darlene et al., 2012], so Neem and castalagin could introduce a help for suppression of colorectal carcinoma.
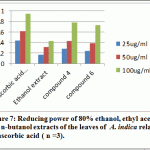 |
Figure 7: Reducing power of 80% ethanol, ethyl acetate and n-butanol extracts of the leaves of A. indica relative to ascorbic acid ( n =3) |
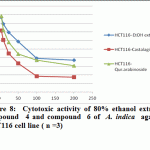 |
Figure 8: Cytotoxic activity of 80% ethanol extract, compound 4 and compound 6 of A. indica against HCT116 cell line ( n =3) |
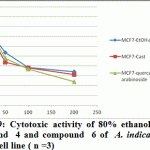 |
Figure 9: Cytotoxic activity of 80% ethanol extract, compound 4 and compound 6 of A. indica against MCF7 cell line ( n =3) |
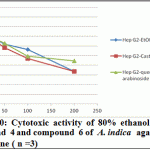 |
Figure 10: Cytotoxic activity of 80% ethanol extract, compound 4 and compound 6 of A. indica against Hep G2 cell line ( n =3) |
Acknowledgment
The authors would like to thank the Deanship of Scientific Research and the Institute of Scientific Research and Revival of Islamic Heritage at Umm Al-Qura University, KSA (Project ID: 4331014) for the financial support.
Refrences
- Abdul R Sibiani, Mahmoud Shaheen, Hind I Fallatah, Hisham O Akbar, Yousif A Qari, Salim Bazaraa, Adnan Merdad, Fatema Al-Thubaity. Colorectal Cancer in Saudi Arabia King Abdul Aziz University Hospital: A Five Year Experience. Journal of Medicine and Medical Sciences Vol. 2(10) pp. 1126-1130, October 2011
- Amer H, Helmy WA and Taie HA, 2010. invitro Antitumour activities of seeds and leaves Neem (Azadirachta indica) extracts. International journal of Academic research. 2(2), 165-171.
- Agrawal PK. (1989). Studies in organic chemistry 39, 13C NMR of flavonoids. In: Agrawal PK, Bansal MC, eds. Flavonoid Glycosides. New York: Elsevier Science, pp. 283–364.
- Boyd MR. (1997). The NCI in vitro anticancer drug discovery screen: Concept, implementation and operation (1985–1995). In: Teicher BA, ed. Anticancer Drug Development Guide, Preclinical Screening, Clinical Trials and Approval. Totowa, NJ: Humana Press, pp. 23–42.
- Brasseur T, Angenot L. (1986). Reagents for densitomeric determination of flavonoids. J Chromatography, 351, 351–355.
- Babu, VS, Narasimhan, S, Nair, GM. Short communication: Enhanced accumulation of triterpenoids and flavonoids in cell suspension cultures of Azadiracta indica with an extended stationary phase. Indian Journal of Biotechnology 2008; 7: 270-272.
- Bailey LH, 1953. The Standard Cyclopedia of Horticulture”, The Macmillan Company, New York.
- Bansal P, Bansal R, Gupta V. Antifertility effects of Azadirachta indica (Neem) – A review. Ann Biol Res 2010; 1(2): 108-113.
- Bandyopadhyay U, Biswas K, Chatterjee R, Bandyopadhyay D, Chattopadhyay I, Ganguly CK, et al. Gastroprotective effect of Neem (Azadirachta indica) bark extract: possible involvement of H(+)-K(+)-ATPase inhibition and scavenging of hydroxyl radical. Life Sci 2002; 71(24): 2845-2865.
- Baral R, Chattopadhyay U. Neem (Azadirachta indica) leaf mediated immune activation causes prophylactic growth inhibition of murine Ehrlich carcinoma and B16 melanoma. Int Immunopharmacol 2004; 4(3): 355-366.
- Bendini A., Cerretani L., Pizzolante L., Gallina-Toschi T., Guzzo F., Ceoldo S., Marconi A. M., Andreetta F. and Levi M., “Phenol Content Related to Antioxidant and An-timicrobial Activity of Passiflora Spp. Extracts,” Euro-pean Food Research and Technology, Vol. 223, No. 1, 2006, pp. 102-109. doi.org/10.1007/s00217-005-0150-7
- Boadu KO, Tulashie SK, Anang MA, Kpan JD. Production of natural insecticide from Neem leaves (Azadirachta indica). Asian J Plant Sci Res 2011; 1(4): 33-38.
- Biswas K., Chattopadhyay I., Banerjee R. K., and Bandyopadhyay U., “Biological activities and medicinal properties of neem (Azadirachta indica),” Current Science, vol. 82, no. 11, pp. 1336–1345, 2002.
- Bhanwra S., Singh J., and Khosla P., “Effect of Azadirachta indica (Neem) leaf aqueous extract on paracetamol-induced liver damage in rats,” Indian Journal of Physiology and Pharmacology, vol. 44, no. 1, pp. 64–68, 2000.
- Chattopadhyay R. R., “Possible mechanism of hepatoprotective activity of Azadirachta indica leaf extract: part II,” Journal of Ethnopharmacology, vol. 89, no. 2-3, pp. 217–219, 2003. View at Publisher · View at Google Scholar ·
- Chatterjee A and Pakrashi S, 1994. The Treatise on Indian Medicinal Plants, 3, p. 76.
- Chopra RN, Chopra IC, Handa KL and Kapur LD, 1958. Indigenous Drugs of India, U.N. Dhur and Sons, Kolkata, pp. 51–595.
- Chopra RN, Nayer SL and Chopra IC (1956). Glossary of Indian Medicinal Plants, CSIR, New Delhi.
- Chakroborty, T, Verotty, L, Poddar, G. Evaluation of Azadirachta indica leaf extract for hypoglycaemic activity in rats. Phytotherapy Research 1989; 3: 30-32.
- Clayton, T., Soralump, P., Chaukul, W., Temsiririrkkul, R., 1996. Medicinal Plants in Thailand, vol. 1. Amarin Printing, Bangkok. Shibata, K., 1955. Basic Statistics for Biologist. Tokyo Shobun Publishing Co., pp. 64–78.
- Darlene Veruttipong, Amr S Soliman, Samuel F Gilbert, Taylor S Blachley, Ahmed Hablas, Mohamed Ramadan, Laura S Rozek, Ibrahim A Seifeldin (2012). Age distribution, polyps and rectal cancer in the Egyptian population-based cancer registry. World J Gastroenterol, 14; 18(30): 3997-4003.
- Denardi SE, Bechara GH, Oliveira PR, Camargo-Mathias MI. Azadirachta indica A. Juss (neem) induced morphological changes on oocytes of Rhipicephalus sanguineus (Latreille, 1806) (Acari: Ixodidae) tick females. Exp Parasitol 2010; 126(4): 462-470.
- Dholi SK, Ramakrishna R, Mankala SK and Nagappan K, 2011. invivo Antidiabetic evaluation of Neem leaf extract in alloxan induced rats. Journal of applied Pharmaceutical science, 7, 100-105.
- Dlugosz A., Lembas-Bogaczyk J. and E. Lamer-Zaraw- ska, “Antoxid Increases Ferric Reducing Antioxidant Po- wer (FRAP) even Stronger than Vitamin C,” Acta Poloniae Pharmaceutica, Vol. 63, 2006, pp. 446-448.
- Ejoba Raphael. Phytochemical constituents of some leaves extract of Aloe vera and Azadirachta indica plant species. Global Advanced Research Journal of Environmental Science and Toxicology Vol. 1(2) pp. 014-017, May, 2012
- EI-Mahmood AM, Ogbonna OB and Raji M, 2010.The antibacterial activity of Azadirachta indica (Neem) associated with eye and ear infections. Journal of medicinal plant Research, 4 (14).1414-142.
- Engler A, Melchoir H and Werdmann E, 1954, 1964. Syllabus der Pflanzenfamilien: mit besonderer Berücksichtigung der Nutzpflanzen nebst einer Übersicht über die Florenreiche und Florengebiete der Erde, 12th ed. (2 vols.), Gebrüder Borntraeger Verlag, Berlin, 367 + 666 p.
- Evans, WC, 1996 in Trease and Evans Pharmacognosy”; 14th ed.; WB Saunders Company Ltd., London, Philadelphia, Toronto.
- Gupta, R.K., Al-Shafi, S.M., Layden, K., Haslam, E. (1982) The metabolism of gallic acid and hexahydroxydiphenic acid in plants. Part 2. Esters of (S)-hexahydroxydiphenic acid with D-glucopyranose (4C1). Journal of the Chemical Society Perkin Transactions 1. 2525-2534.
- Garima Pandey, Verma KK, Munna Singh. Evaluation of phytochemical, antibacterial and free radicalscavenging properties of Azadirachta indica (Neem) leaves. Journal of Pharmacy and Pharmaceutical Sciences. Vol 6 Issue 2, 2014 . 444-447.
- Haggag G. Eman, Amel M. Kamal, Mohamed I. S. Abdelhady, Mortada M. El-Sayed, Eman A. El-Wakil, and Sayed S. Abd-El-hamed. Antioxidant and cytotoxic activity of polyphenolic compounds isolated from the leaves of Leucenia leucocephala. Pharmaceutical Biology, 2011; 49(11): 1103–1113.
- Haque E, Baral R. Neem (Azadirachta indica) leaf preparation induces prophylactic growth inhibition of murine Ehrlich carcinoma in Swiss and C57BL/6 mice by activation of NK cells and NK-T cells. Immunobiology 2006; 211(9): 721-731.
- Habila N, Humphrey NC, Abel AS. Trypanocidal potentials of Azadirachta indica seeds against Trypanosoma evansi. Vet Parasitol 2011; 180(3-4): 173-178.
- Harborne JB. (1994). The Flavonoids: Advances in research since 1986. In: Williams CA, Harborne, JB eds. Flavone and Flavonol Glycoside;. London: Chapman & Hall, Ltd, University Press Cambridge, pp. 337–385.
- Imran Khan, Surya Rao Srikakolupu, Surekha Darsipudi, Srujana Divya Gotteti and Hemasundara Amaranadh.Ch. Phytochemical studies and screening of leaf extracts of Azadirachta indica for its anti-microbial activity against dental pathogens. Archives of Applied Science Research, 2010, 2 (2):246-250
- Kirtikar KR and Basu BD, 1975. in Medicinal Plants (eds Blatter, E., Cains, J. F., Mhaskar, K. S.), Vivek Vihar, New Delhi, p. 536.
- Koul O, Isman M B and Ketkar CM, 1990. Properties and uses of neem, Azadirachta indica. Can. J. Bot. 68, 1–11.
- Kumar KS, Ganesan K, Rao PV. (2008). Antioxidant potential of solvent extracts of Kappaphycus alverezii (Doty). Food Chem, 107, 289–295.
- Kumaran A, Karunakaran RJ. (2006). In vitro antioxidant activities of methanol extracts of fine Phyllunthus species from India. Food Sci Technol, 40, 344–352.
- Mabry, T.J., Markham, K.R., Thomas, M.B. (1970). The systematic identification of flavonoids. In: The ultraviolet spectra of flavones and flavonols, Part II, Chapter V, Berlin, Springer Verlag, pp. 41-164.
- Marzouk, M.M., Kawashty, S.A., Saleh, N.A.M., Al-Nowaihi, A.S.M., 2009. A new kaempferol trioside from Farsetia aegyptia. Chem. Nat. Compd. 45, 483–485.
- Moharram, F.A., Marzouk, M.S., El-Toumy, S.A.A., Ahmed, A.A.E., Aboutabl, E.A. (2003) Polyphenols of Melaleuca quinquenervia leaves-pharmacological studies of grandinin. Phytotherapy Research 17: 767-773.
- Mensor LL, Menezes FS, Leitمo GG, Reis AS, dos Santos TC, Coube CS, Leito SG. (2001). Screening of Brazilian plant extracts for antioxidant activity by the use of DPPH free radical method. Phytother Res, 15, 127–130.
- Mohamed H, Ons M, Yasea, ET, Rayda S, Neji G, Moncef N. (2008). Chemical composition and antioxidant and radical scavenging activities of Periploca iaevigata rook bark extracts. J. Sci. Food Agric, 89, 897–905.
- Maragathavalli S, Brindha S, Kaviyarasi NS, Annadurai B, and Gangwar SK, 2012. Antimicrobial activity in leaf extract of neem (Azadirachta indica linn.) I.j.s.n., vol. 3(1). 110-113.
- Mardiha, MAU, Al-Shyhaibani NA, (2014). Prospect of Neem Plantation at Arafat, Saudi Arabia. Current World Environment. 9(1), 81-86.
- Monirul I, Al-Amin1 Md., Mahboob A S , Shakila Akter, Mohammad Majedul H, Nasim S and Sarwaruddin C. Isolation of Quercetin-3-O-beta-d-glucopyranoside from the Leaves of Azadirachta Indica and Antimicrobial and Cytotoxic screening of the Crude Extracts. Dhaka Univ. J. Sci. 60(1): 11-14, 2012
- Murthy, P.S., Sirsi, M., 1958. Pharmacological studies on Melia azadirachta. Indian J. Psychol. 2 (2), 387–396.
- Newman D. J., Gragg G. M., Holbeck S. and Saus-ville E. A., “Natural Products as Leads to Cell Cycle Pathway Targets in Cancer Chemotherapy,” Current Cancer Drug Targets, Vol. 2, No. 4, 2002, pp. 279-308. doi.org/10.2174/1568009023333791
- Okuda, T., Yoshida, T., Hatano, T., Yazaki, K., Ashida, M. (1982) Ellagitannins of the Casuarinaceae, Stachyuraceae and Myrtaceae. Phytochemistry 21: 2871-2874.
- Okuda, T., Yoshida, T., Hatano, T., Ashida, M., Yazaki, K. (1983) Tannis of Casuarina and Stachyurus species. Part 1. Structures of pendunculagin, casuarictin, strictinin, casuarinin, casuariin, and stachyurin. Journal of the Chemical Society Perkin Transactions 1. 1765-1772.
- Okuda, T., Yoshida, T., Hatano, T. (1989) New methods of analyzing tannins. Journal of Natural Products 52: 1-31.
- Oyaizu M. (1986). Antioxidant activity of brewing products of glucosamine fractionated by organic solvents and their layer chromatography Nippon Skokulin Kogyo Gakkaishi, 32, 771–775.
- Rajkumar V., Guha H. and Kumar R. A., “Antioxidant and Anticancer Potentials of Rheum Emodi Rhizome Ex-tracts,” Food and Chemical Toxicology, Vol. 49, No. 2, 2011, pp. 363-369.
- Paul R, Prasad M, Sah NK. Anticancer biology of Azadirachta indica L (neem). Cancer Biol Ther. 2011 Sep 15;12(6):467-76. Epub 2011 Sep 15.
- Parekh J, Chanda SV. In vitro antimicrobial activity and phytochemical analysis of some Indian medicinal plants. Turk J Biol 2007;31:53-8.
- Patel DK, Kumar R, Prasad SK, Hemalatha S. Pharmacologically screened aphrodisiac plant-A review of current scientific literature. Asian Pac J Trop Biomed 2011; 1(1): S131-S138.
- Singh R, Singh B, Singh S, Kumar N, Kumar S, Arora S. (2009). Investigation of ethyl acetate extract fraction of Acacia nilotica Willd Ex Del as potent antioxidant. Rec. Nat. Prod, 3, 131–138.
- Skehan P, Storeng R, Scudiero D, Monks A, McMahon J, Vistica D, Warren JT, Bokesch H, Kenney S, Boyd MR. (1990). New colorimetric cytotoxicity assay for anticancer-drug screening. J Natl Cancer Inst, 82, 1107–1112.
- Santra KB, Manna CK. Antifertility effect of leaf extract of neem (Azadirachta indica) othe male wild Indian house rat (Rattus rattus). Pharmacologyonline 2009; 2: 1025-1037.
- Schmutterer, H., 1995. The neem tree, source of unique natural products for integrated pest management, medicine, industry and other purposes, vol. 7. VCH Publishers Inc., New York, USA, pp. 35–89.
- Sharma A, Bhattacharyya KG. Azadirachta indica (Neem) leaf powder as a biosorbent for removal of Cd(II) from aqueous medium. J Hazard Mater 2005; 125(1): 102-112.
- Sathiyaraj K, Sivaraj A, Kumar PV, Devi K, Kumar BS. Spermicidal activity of Azadirachta indica (Neem) aqueous leaf extract on male albino rats. Int J Pharm Tech Res 2010; 2(1): 588- 591.
- Singh UP1, Maurya S, Singh DP. Phenolic acids in neem (Azadirachta indica): a major pre-existing secondary metabolites. J Herb Pharmacother. 2005;5(1):35-43.
- Sonia B and Srinivasan BP, 1999. Investigation into the Anti diabetic activity of Azadirachta indica. Indian journal of pharmacology,31.138-141.
- Silici S., Ekmekcioglu O., Kanbur M., and Deniz K., “The protective effect of royal jelly against cisplatin-induced renal oxidative stress in rats,” World Journal of Urology, vol. 29, no. 1, pp. 127–132, 2011. View at Publisher · View at Google Scholar · View at Scopus
- Sithisarn P., Supabphol R., and Gritsanapan W., “Antioxidant activity of Siamese neem tree (VP1209),” Journal of Ethnopharmacology, vol. 99, no. 1, pp. 109–112, 2005. View at Publisher · View at Google Scholar · View at Scopus
- Servettaz, O, Colombo, M. L., De Bernardi, M., Uberti, E., Vidari, G., Vita-Finzi, P. (1984) Flavonol glycosides from Dryas octopetala. Journal of Natural Products 47: 809-814.
- Tanaka, T., Nonaka, G. and Nishioka, I., 1985. Punicafolin, an ellagitannin from the leaves of Punica granatum. Phytochemistry 24, 2075-2078.
- Tanaka, T., Nonaka, G. and Nishioka, I., 1986a. Tannins and related compounds. Part 40. Revision of the structures of punicalin and punicalagin, and isolation and characterization of 2-O-galloylpunicalin from the bark of Punica granatum L.. Chemical and pharmaceutical bulletin, 34, 650-655.
- Tanaka, T., Nonaka, G. and Nishioka. I., 1986b. Tannins and related compounds. Part 41. Isolation and characterization of novel ellagitannins, punicacorteins A, B, C and D, and punigluconin from the bark of Punica granatum L.. Chemical and pharmaceutical bulletin, 34, 656-663.1985, 24, 2075-2078.
- Trease, G.E and Evans, W.C (1989). A textbook of pharmacognosy 12th ed. Bailliere Tindal Ltd., London. Pp. 374-726.
- Takaki-Doi S., Hashimoto K., Yamamura M., and Kamei C., “Antihypertensive activities of royal jelly protein hydrolysate and its fractions in spontaneously hypertensive rats,” Acta Medica Okayama, vol. 63, no. 1, pp. 57–64, 2009. View at Scopus
- Van der Nat, J.M., Van der Sluis, W.G., Silva, K.T.D., Labadie, R.P., 1991. Ethnopharmacognostical survey of Azadirachta indica A. Juss (Meliaceae). J. Ethnopharmacol. (35), 1–24.
- Vivas, N., Laguerre, M., Glories, Y., Bourgeois, G., Vitry, C. (1995) Structure simulation of two ellagitannins from Quercus robur L. Phytochemistry 39: 1193-1199.
- Wojdylo A., Oszmianski J. and Czemerys R., “Antioxidant Activity and Phenolic Compounds in 32 Selected Herbs,” Food Chemistry, Vol. 105, No. 3, 2007, pp. 940- 949. doi.org/10.1016/j.foodchem.2007.04.038
- Yang, LL; Lee, CY; Yen, KY; Induction of apoptosis by hydrolyzable tannins from Eugenia jambos L. on human leukemia cells. Cancer letters, issue: 1, volume: 157, year: 2000, pages: 65 – 75
- Yildirim A, Mavi A, Kara AA. (2000). Determination of antioxidant and antimicrobial activities of Rumex cripus L. extracts. J. Agric. Food Chem, 49, 4083–4089.

This work is licensed under a Creative Commons Attribution 4.0 International License.


