

Manuscript accepted on :
Published online on: 17-12-2015
Analysis of Efficiency of Production Process and Ready Products
Kairat Mukhamedzhanov Khamitovich, Asya Demeukhanovna Serikbaeva
Kazakh National Agrarian University, Abay Ave. 8, Almaty - 050010
ABSTRACT: The aim of this paper is to analyze the efficiency of production process and ready products in the certain production environment before implementing Hazard Analysis and Critical Control Points quality provision system.
KEYWORDS: Hazard Analysis; Critical Control Points; Efficiency estimation; quality estimation systems; software
Download this article as:| Copy the following to cite this article: Khamitovich K. M, Serikbaeva A. D. Analysis of Efficiency of Production Process and Ready Products. Biosci Biotech Res Asia 2015;12(2) |
Introduction
At the present time great attention is paid to quality and safety of the produced goods. Only stable quality of goods can attract the customer and provide the enterprise with profit under conditions of market relations.
It becomes an inescapable fact that the customer has the right to expect the food products he/she uses to be safe (non-hazardous), fit for human consumption and, what is important, be a source of all substances required for correct development [1, 2]. Illnesses and disorders caused by food products are unpleasant as their best and deathful at worst. That’s why providing food products safety and harmlessness is a part of the state policy implemented in order to carry on the law and fundamental rights of a human being, implementing state guarantees in the area of food safety including the area of population protection under conditions of food crisis [2, 3, 4 and other]. These measures are implemented by the state government, state government bodies of the state subjects, and state services and inspectorates within the limits of their competence. However, it is almost impossible to solve food products safety and harmlessness without active activity of enterprises producing, storing, and selling food products in this area [5].
Quality and safety of food products production must be guaranteed for consumers regardless of what share of the market is occupied by a specific producer. At the present time foremost large companies producing food products managed to maintain the developed systems of veterinary, production and laboratory control. However, this set of measures is not sufficient for providing stability and guaranteeing food products safety. It also does not comply with all requirements of standards of European and international food law (6, 7, 8, etc.) ,including the ones related to systematization of measures in the area of food products safety and preparation of producers’ documents confirming the implementation of all planned actions and measures.
It was repeatedly noted that a lot of such enterprises have deficiently adequate programs of products safety and quality management and do not comply with national requirements on sanitary of producing premises and personnel hygiene, characteristics of the processed raw materials, applied technologies, qualifications of leading specialists, technical support and other requirements. Herewith, the biggest part of arising problems is caused by constrained practice of appropriate production processes management and issues of safety while producing products are keen at these enterprises. The situation is complicated by the fact that foremost products of medium-sized, small and extra-small enterprises are sold through food markets where the probability of violations during storing and selling products is high.
Taking into account the stated above, this research aims to develop and determine criteria of estimating the efficiency of the production process and ready products.
Methodology
The objects of the research are the technological process of producing such fermented dairy food based on camel milk as
- “Camel milk pasteurized ”
- “Camel milk improved”
- “Camel bio milk”
at the “Daulet’Beket” LLC dairy enterprise situated in the village of Akshi, Almaty region.
This production process is studied and regulated in sufficient details. Herewith, it is not planned to make any sufficient changes in the process of producing dairy products as it is not the research aim.
The works were performed in accordance with indicators and norms regulated by the organization Standards.
Physical and chemical and microbiological indicators were tested in the accredited test laboratory. When performing all researches average samples regulations were strictly complied with, every sample was tested twice for the same indicator deducting the average indicator.
In order to achieve the set aim and solve the tasks of this work, the following methodologies and regulating
procedures of collecting and processing initial data [9],
methods of estimating the ready product quality and safety including microbiological, chemical and physical methods [10, 11],
methods of estimating the efficiency of the production process,
methods of statistical processing of results.
In order to determine the indicators characterizing the ready product in the context of quality and safety, standardized methodologies regulated by normative, governing and methodological documents. Data on the control indicators and current governing documents are reported in Table 1.
Table 1: Quality and Safety Indicators Regulated for Fermented Dairy Products
| Ser. No. | Indicators | Governing document that regulates the methodology of defining indicators |
| 1 | 2 | 3 |
| Safety indicators (regulated by SanPiN 2.3.2.1078-01) | ||
| 1. | Toxic elements | GOST 26929-94 Feed and Food Product. Samples Preparation. Mineralization for Determining Toxic Elements |
| 1.1. | Plumbum | GOST 26932-86 Feed and Food Product. Methods of Determining Plumbum |
| 1.2. | Arsenium | GOST 26930-86 Feed and Food Product. Methods of Determining Arsenium |
| 1.3. | Cadmium | GOST 26933-86 Feed and Food Product. Methods of Determining Cadmium |
| 1.4. | Hydrargyrum | GOST 26927-86 Feed and Food Product. Methods of Determining Hydrargyrum |
| 2. | Antibiotics | MG 4.2.026-95 Express-Method Determination of Antibiotics in Food Products
IG 3049-84 Methodological Recommendations on Determining Antibiotics Residuals in Animal Products |
| 2.1. | Tetracyclines | MG 4.2.026-95 Express-Method Determination of Antibiotics in Food Products
IG 3049-84 Methodological Recommendations on Determining Antibiotics Residuals in Animal Products |
| 2.2. | Grisin | MG 4.2.026-95 Express-Method Determination of Antibiotics in Food Products
IG 3049-84 Methodological Recommendations on Determining Antibiotics Residuals in Animal Products |
| 2.3. | Bacitracin | MG 4.2.026-95 Express-Method Determination of Antibiotics in Food Products
IG 3049-84 Methodological Recommendations on Determining Antibiotics Residuals in Animal Products |
| 2.4. | Laevomycetin | MR 4.18/1890-91 Methodological Recommendations on Detecting, Identifying and Determining Laevomycetin Residuals in Animal Products |
| 3. | Pesticides | IG 1222-75 Determining Organochloride Pesticides |
| 3.1. | Hexachlorane | IG 1222-75 Determining Organochloride Pesticides |
| 3.2. | Dichloro-diphenyl-trichloroethane and metabolites | IG 1222-75 Determining Organochloride Pesticides |
| 4. | Radionuclides | IG 2.6.1.1194-03 Radiation Survey. Strontium-90 Caesium 137. Food Products. Selecting Samples, Analysis and Hygienic Estimation |
| 4.1. | Caesium-137 | IG 2.6.1.1194-03 Radiation Survey. Strontium-90 Caesium 137. Food Products. Selecting Samples, Analysis and Hygienic Estimation |
| 4.2. | Strontium-90 | IG 2.6.1.1194-03 Radiation Survey. Strontium-90 Caesium 137. Food Products. Selecting Samples, Analysis and Hygienic Estimation |
| 5. | Nitrosamine | MG 4.4.1.011 -93 Determining Fugitive N-Nitrosamines in Food Staples and Food Products |
| 6. | Microbial attributes | GOST Р 51448-99 Fermented Dairy Products. Methods of Preparing Samples for Microbiological Researches |
| 6.1. | QMA&OAMO | GOST 10444.15-94 Food Products. Methods of Determining the Amount of Mesophilic Aerobian and Facultative Aerobian Microorganisms |
| 6.2. | Coliform bacteria | GOST 30726-2001 Food Products. Methods of Determining the Amount of Bacteria GOST R |
| 6.3. | Sulfite-reducing clostridia | GOST 29185-91 Food Products. Methods of Detecting and Determining the Amount of Sulfite-reducing Clostridia |
| 6.4. | S. aureus | GOST 10444.2-94 Food Products. Methods of Detecting and Determining the Amount of Staphylococcus aureus |
| 6.5. | Pathogenics including salmonella | GOST Р 50480-93 Food Products. Methods of Detecting Salmonella Bacteria |
| 6.6. | L. monocytogenes | GOST Р 51921-2002 Food Products. Methods of Detecting and Determining the Amount of Listeria Monocytogenes Bacteria |
| 7. | Sensory characteristics | GOST Р 52687-2006 Fermented Dairy Products, Enriched with Bifid Bacterium. Regulations of Accepting and Methods of Samples Selection |
| 7.1. | External appearance | GOST Р 51331-99 Dairy Products. General technical Specifications |
| 7.2. | Body | GOST Р 51331-99 Dairy Products. General technical Specifications |
| 7.3. | Color | GOST Р 51331-99 Dairy Products. General technical Specifications |
| 7.4. | Taste | GOST Р 51331-99 Dairy Products. General technical Specifications |
| 7.5. | Flavor | GOST Р 51331-99 Dairy Products. General technical Specifications |
The indicators of the efficiency of the fermented dairy products production process were determined by estimating the correspondence the measured data as a result of the process with the process data that was planned including according to the marked indicators:
- implementing the production plan related to the production of ready product, percent of the implemented one as to the target,
- amount of the produced ready products which discrepancies have been revealed before forwarding to the consumer, percent as to the volume of the produced products,
- amount of the inappropriate products received as a result of production which discrepancies have been revealed by the consumer, percent as to the produced products,
- return of the critical raw materials to the supplier according to the results of the incoming control, percent of the analyzed critical raw materials,
- amount of semi-finished product with discrepancies according to key technological processes, percent as to the performed volume.
As the enterprises perform their activity on commercial basis, the efficiency directly depends on the requests of retail and wholesale outlet chains and the possibilities to sell through factory stores. In order to minimize the impact of the quantity of the produced products to the level of estimating the efficiency of the production process, relative indicators expressed in percent were taken as efficiency indicators [12]. In order to calculate indicators, the following formulas were applied:
Indicator 1.
F/P × 100%, where
P is a target volume of ready products production volume per shift, kg;
F is an amount of relevant ready products actually produced per shift, kg.
Indicators 2 and 3 were calculated according to the following formula:
N/F ×100%, X/F × 100 %,
N is a total amount of inappropriate products revealed at the final production stage before shipping for selling and during selling before forwarding to commercial enterprises per shift, kg;
X is an amount of inappropriate products revealed by the products consumer or employees of commercial enterprises and returned or documented by the reclamation certificate bound to a specific shift, kg.
Indicator 4 was calculated according to the following formula:
B/P × 100%, where
B is a volume of critical raw materials returned to the supplier for any reason per shift, kg;
P is a volume of critical raw materials delivered to the enterprise per shift, kg.
Regardless of the production process stage, Indicator 5 was calculated according to the following formula:
N/P × 100%,
where
N is a volume of inappropriate semi-finished products according to the technological process received at the specific stage of the production process revealed at this stage or later before receiving a ready product but with a cause of the specific stage process trouble proved unambiguously per shift, kg;
P is a volume of remanufactured critical raw materials or semi-finished products according to the technological process accepted for producing in the specific production area per shift, kg.
Results
The data received as a result of testing ready products of the selected range was collected and analyzed for vicarious estimation of the efficiency of the quality system functioning at the enterprise and efficiency of the production process. The tests were performed during the first stage of works on developing and implementing the system in the period from March to August 2012 in accordance with the indicators of cl. 2.3.3. and norms regulated by TS 9213-015-00422899-2003 and SanPiN 2.3.2.1078-01. Physical and Chemical and Microbiological indicators were tested by the accredited production laboratory. Safety indicators were tested by the accredited testing center.
While carrying out tests, average samples regulations were strictly complied with, every sample was twice tested for the same indicator deducting the average indicator.
The received results of the research for safety indicators did not reveal the excess of the set norms and breakpoints. Thus, all researched samples complied with the requirements of SanPiN 2.3.2.1078-01 and SanpiN 2.3.4.551-96 according to the content of toxic elements, antibiotics, pesticides, radionuclides, coliforms, Sulfite-reducing clostridia, Staphylococcus aureus, pathogenic microorganisms, including salmonella.
For the purpose of data analysis convenience, according to the results of the research, the average indicators of QMAFAnM [Quantity of Mesophilic Aerobic and Facultative Anaerobic Microorganisms] and physical and chemical indicators of quality and standard deviations from the general totality are reported in the diagrams (Fig. 1-2).
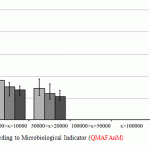 |
Figure 1: Research Results according to Microbiological Indicator (QMAFAnM) |
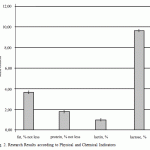 |
Figure 2: Research Results according to Physical and Chemical Indicators |
In the process of the diagnostic audit and ready products researches it was determined that the system of quality and safety control has a number of weak points. First of all, it includes non-availability of regulated ways of collecting and transferring information that considerable decreases the efficiency and effectiveness of the quality system as a whole. Along with this, there is a large number of separate elements of the system covering the activity of separate structural subdivisions or separate chains of subprocesses. A great number of these processes are rather efficient, first of all, in relation to revealing inappropriate products rather than preventing its production. That’s why for the purpose of vicarious estimation of the efficiency of the ready products quality system functioning at the enterprise, data characterizing the efficiency of the production of dairy products selected from the range was collected and analyzed. Data was collected on a weekly basis during five months.
While collecting information, the following was noticed: in the majority of cases inappropriate products revealed before the completion of the technological process at the order of the job foreman or shiftable technologist was sent to reproduction within the work site or the area of reproducing such materials was changed within the production process. That’s why such rearrangements were not fixed as inappropriate products in production reports. For the purposes of the research, we found the opportunity to calculate this indicator of inappropriate products received at various stages of the production process. As it was not possible to notice and calculate this indicator at all work centers, we have chosen key technological operations where critical raw materials undergo considerable qualitative changes, in particular homogenization of the dairy mixture, pasteurization, souring and ripening of creamy mixture. Consequently, ready products quality and safety depend on such changes to a greater extent. From the other point of view, these stages of the production process have a lot of controlled (including critical) parameters that probably assumes a lot of negative deviations in case of the imperfection of the control (management) control or other weak points in the production process. The collected information is generalized and reported in Table 2.
Table 2: Average Value of Indicators According to Months from January to June 2012 and General Average Value for this Period of Time
| Indicator | Average value of indicators according to months from January to June 2012 and general average value for this period of time | |||||
| January | February | March | April | May | Average | |
| 1 | 2 | 3 | 4 | 5 | 6 | 7 |
| Indicator 1, Meeting of production targets, % | 90.3 | 90.32 | 90.3 | 90.3 | 90.29 | 90.3 |
| ±1.14 | ±1.11 | ±1.14 | ±1.16 | ±1.14 | ±1.14 | |
| Indicator 2, Amount of products which discrepancies were revealed BEFORE delivery to the customer, % | 0.51 | 0.53 | 0.53 | 0.49 | 0.48 | 0.5 |
| ±0.05 | ±0.03 | ±0.05 | ±0.03 | ±0.06 | ±0.04 | |
| Indicator 3, Amount of products which discrepancies were revealed by the CUSTOMER, % | 0.33 | 0.34 | 0.32 | 0.31 | 0.36 | 0.33 |
| ±0.05 | ±0.03 | ±0.05 | ±0.03 | ±0.08 | ±0.05 | |
| Indicator 4.1, Number of cases when discrepancies were revealed during the process of Accepting and sorting milk | 10.03 | 10 | 10.04 | 10.03 | 10.02 | 10.02 |
| ±3.16 | ±3.14 | ±3.17 | ±3.15 | ±3.19 | ±3.16 | |
| Indicator 4.2, Number of cases of reveling discrepancies during the Clearing process | 0.02 | 0.03 | 0.03 | 0.01 | 0.02 | 0.02 |
| ±0.15 | ±0.02 | ±0.01 | ±0.01 | ±0.01 | ±0.04 | |
| Indicator 4.3, Number of cases of revealing discrepancies during the Normalization process | 0.01 | 0.01 | 0.02 | 0.04 | 0.02 | 0.02 |
| ±0.01 | ±0.01 | ±0.01 | ±0.02 | ±0.01 | ±0.01 | |
| Indicator 4.4, Number of cases of revealing discrepancies during the infant milk mixture Homogenization process | 0.03 | 0.01 | 0.04 | 0.05 | 0.03 | 0.03 |
| ±0.02 | ±0.01 | ±0.02 | ±0.03 | ±0.01 | ±0.02 | |
| Indicator 4.5, Number of cases of revealing discrepancies during the Pasteurization process | 0.02 | 0.01 | 0.05 | 0.05 | 0.03 | 0.03 |
| ±0.01 | ±0.01 | ±0.02 | ±0.02 | ±0.02 | ±0.02 | |
| Indicator 4.6, Number of cases of revealing discrepancies during Souring and Ripening creamy mixture | 0.02 | 0.05 | 0.02 | 0.02 | 0.03 | 0.03 |
| ±0.01 | ±0.01 | ±0.01 | ±0.01 | ±0.02 | ±0.01 | |
| Indicator 4.7, Number of cases of revealing discrepancies during Cooling and Mixing | 0.02 | 0.01 | 0.02 | 0.04 | 0.01 | 0.02 |
| ±0.01 | ±0.01 | ±0.01 | ±0.02 | ±0.01 | ±0.01 | |
| Indicator 4.8, Number of cases of revealing discrepancies during the Bottling process | 0.04 | 0.06 | 0.07 | 0.07 | 0.04 | 0.06 |
| ±0.02 | ±0.03 | ±0.02 | ±0.04 | ±0.02 | ±0.02 | |
| Indicator 4.9, Number of cases of revealing discrepancies during Aftercooling and ripening | 0.05 | 0.04 | 0.04 | 0.02 | 0.03 | 0.04 |
| ±0.02 | ±0.03 | ±0.02 | ±0.01 | ±0.01 | ±0.02 | |
| Indicator 4.10, Number of cases of revealing discrepancies during ready product quality Control | 0.09 | 0.07 | 0.07 | 0.11 | 0.12 | 0.09 |
| ±0.02 | ±0.01 | ±0.04 | ±0.04 | ±0.03 | ±0.03 | |
| Indicator 4.11, Number of cases of revealing discrepancies during Storage | 0.07 | 0.04 | 0.04 | 0.09 | 0.1 | 0.07 |
| ±0.04 | ±0.06 | ±0.02 | ±0.07 | ±0.03 | ±0.04 | |
Discussion
The results showed that as a whole the results in the sanitary relation are good as neither of the research results was negative or contiguous that would allow to have doubts about the safety of ready food products from the microbiological perspective [13]. However, improvements of production process are possible from sanitary perspective in consequence of
– great scatter of the received results (standard fluctuations make up from 14% of the average value volume),
– relative increase in QMA&OAMO by 25.4% in ready products as to the data of the previous researches.
Along with this, the results of products research have a great scatter [14]. For example, standard fluctuations as for the fat mass share are from 3.15 to 3.25 whereas the value of the indicator itself does not exceed 1.4%.
In some ready product samples it was revealed the excess of fat share as the production technology allowed fluctuations of the fat mass share +0.1% because the content of fat in camel milk fluctuates within rather wide range that depends on the type, season, food, individual and other factors.
Ready product according to mass share of protein as well as other indicators did not have any excess, however, the scatter of indicators is as wide (standard fluctuations are from 0.98% to 1.01%). In addition, all researches had the Acidity lower than the one regulated by the governing document by the value that is up to 5% of the regulated one.
The research results witness about instability of qualitative characteristics during the production process. Measures that are available and the control system allow to efficiently reveal discrepancies (including according to consumer-oriented characteristics of products) after they occurred during production. Discrepancies in ready products that were revealed before selling reach 0.53%, the average number is 0.50% [15].
There are returns and reclamations from trade enterprises. In spite of the fact that no significant (critical) discrepancies were revealed among such cases, the percent of returns is 0.33% (data does not include returns related to shelf life expiration). The maximum volume of returns was 0.5%.
In spite of the available regulations of production operations, some stages of production process include rather large volume of discrepancies, and their scatter is rather big. The following is especially characteristic: at the stage of soaking and ripening creamy mixture the minimal number of discrepancies was 0.02%, and minimal was 0.05%. The diagram demonstrates data on this process (Fig. 3).
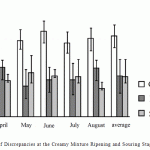 |
Figure 3: Number of Discrepancies at the Creamy Mixture Ripening and Souring Stages |
The analysis of the collected information showed that the technological process described in the instructions had been carried out by the workforce every time with few discrepancies that were not fixes and related to causes [16]. As a result, the discrepancies that had occurred were not analyzed by specialists and subsequently were not prevented. That is every time the technological process was carried out by the workforce according to the same chain in spite of the previous results.
All fluctuations in the production process registered at the moment of data collection caused expenses of various origin for the enterprise including:
intrinsic value of inappropriate product or semi-finished product according to the technological process,
shortfall in profits because these products are not sold,
cost of excess production time,
utilization expenses in case of products utilization,
compensation for damage according to reclamations, claims consideration, transportation of returned products, etc.
These expenses were not singled out as additional that led to unreasonable appreciation of the whole production process that had a negative impact on the product cost, and finally, its competitiveness. In most cases the analysis of the character of discrepancies and their reasons came down to the increase and economic penalties of those who were guilty. This circumstance did not stimulate the prevention of similar discrepancies in future by revealing them at initial stages of the process [17].
We made attempts to reveal the objective laws of allocating the cost of inappropriate product depending on the causes of discrepancies. Causes of discrepancies for such indicators as “volume of products which discrepancies have been revealed BEFORE FORWARDING to the consumer” and “volume of discrepancies according to stages of the production process” were revealed and analyzed. Fig. 4 reports the analysis data.
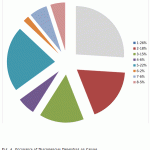 |
Figure 4: Occurrence of Discrepancies Depending on Causes |
(1) Employees’ carelessness or lack of knowledge
(2) Turnover of labor (insufficiency of practical experience)
(3) Non-compliance with parameters and regimes of production
(4) Insufficient equipment
(5) Raw materials, ingredients, supporting materials, etc. that do not comply with the quality requirements or that are not widely controlled
(6) Lack or late transfer of the required information including about changes of the technological process
(7) Actions incoordination
(8) Unknown causes
Conclusion
Thus, it is possible to make the following conclusions from the analyzed data:
- The production process efficiency directly depends on the qualification of the workforce that is directly involved in certain operations (above 44% of discrepancies).
- The second most significant cause of discrepancies is unstable characteristics of the received critical raw materials and additional materials in case of non-availability of prior selection of suppliers (22%) [18].
- In more than 70% of cases, discrepancies are related to the violation of the production process regulations. According to expert estimates, up to 50% of all the discrepancies that occurred could have been prevented.
- There is no well-formed and universal system of ready products quality management.
- Data witness about the absence of violation for the ready products safety.
- It is necessary to improve production [9] process from the sanitary point of view (by regulating programs of god manufacturing practices (GMP)).
- Instability of indicators of ready products quality can be a consequence of the lack of data analysis and instability of certain operations and stages of the performed process, insufficiency of input data for efficient correction of technological process.
The data received during diagnostic audit is the basis for performing the required actions in the production weak points that were revealed. The diagnostic audit revealed a number of directions for improvement and areas where documenting and regulating of processes seem to be most efficient. Diagnostic audit and collection of prior information are obligatory stages during development and implementation of the system [19].
We determined the lack of system identifying raw materials, materials and ready products during the process of production advancement and imperfection of the monitor and traceability system including collecting information on the discrepancies that occur. Thus, technological process was performed by employees according to the planned chain of actions with a small number of various discrepancies that were not analyzed to the full and subsequently prevented to a limited extent.
Applying the process approach while forming the block diagram allowed to concretize the production process to the greatest extent, and also to establish a more flexible system of regulating that ascertains flexible terms and conditions of performing various actions, and the level of responsibility while making decisions and ways of informing in case of discrepancies from the target results. Thus, the reaction in case of any discrepancies will be faster (as in some cases decision will be made by masters directly in the sector) and more objective, since areas of competence of separate enterprise structural subdivisions are separated.
Significant discrepancies on ready products quality and safety were not revealed, however ready products and production process characteristics showed non-stability and unpredictability that permanently cause strengthening of the activity results control and leading such control to total.
The dependence of the production process on the workforce (44% of discrepancies were through the fault of workforce) assumes that basic directions of transformations during the system development and implementation will include the regulation of areas of responsibility, documenting and monitoring of key (critical) operations and multilevel workforce training including that on hazards control [20].
Since the second most significant cause of discrepancies is unstable characteristics of the received critical raw materials and additional materials (22%), while developing and implementing the integral system of quality and safety provision, it is reasonable to pay special attention to prior work with suppliers, including their estimation and practice of auditing made by the “second party”.
While forming the monitoring system at the production, it is necessary to use the algorithm for revealing, monitoring and managing parameters of the technological process as the lack or delay of the information transfer has a negative impact on the activity results (in total up to 11% of discrepancies).
Further works under this direction include the implementation of the system of Hazard Analysis and Critical Control Points, ways of automating this process and analysis of the efficiency of the production process and ready products after implementing the system of Hazard Analysis and Critical Control Points.
References
- Report of a WHO Consultation (World Health Organization) in collaboration with the Ministry of Health, Welfare and Sports Strategies for Implementing HACCP in Small and/or Less Developed Business. The Netherlands The Hague, 16-19 June 2010.
- Regulation (EU) of the European Parliament and of the Council on the hygiene of foodstuffs of 29.04.2009 #852/2009.
- Act of the Republic of Kazakhstan “On Technical regulation” of 09.11.2004 #603-II.
- Act of the Republic of Kazakhstan “On Food Products Safety” (including amendments as of 29.12.2014) of 07.2007 #301-III.
- Porter, C., 2008. Safety of meat products. Meat International, Vol. 12, 6: 12-15.
- White Paper on Nutrition Safety. Official edition, January 12, 2007. European Community Commission. Brussels.
- DS 3027 E, 2012 Management of food safety based on HACCP (Hazard Analysis and Critical Control Point) – Requirement for management system for food production organizations and their suppliers// Standard of Denmark.
- The Secondary Food Law of Great Britain, Enactment about Food Safety of 12.06.1995 #1763.
- ТК РК 4.2-МР-14-2002 Management of Food Products Quality Based on Principles of Hazard Analysis and Critical Control Point. Methodological Recommendations on Collecting and Proceeding Source Data about Products and Production. Official edition.
- List of Basic Current Governing Documents on Methods of Controlling Chemical Substances in Environmental Medium, Working Zone Air, Food Products, 2008. Moscow: Federal Center of State Committee for Sanitary and Epidemiological Oversight of the Ministry of Health of Russia, pp: 19.
- SanPiN 2.3.2.1078-01 Hygienic Requirements to Safety and Nutrition Value of Food Products. Official edition. Ministry of Health of Russia.
- Glazunov, A.V., E.P. Kochetov and V.A. Lapidus, 2009. On Rating Discrepancies Levels in Products Lots (“Zero Defects” Problem). Reliability and Quality Control (Statistical Methods series), 12: 26-29.
- Bolton, M., 2008. Involvement of Company Employees in Quality Increase. European Quality: Digest, 4: 50-54.
- Musaev, A.A. and V.А. Nikitin, 2007. Estimating Quality of Processes Management Based on Multidimensional Statistical Control. Standards and Quality, 12: 38-45.
- Mattias, M., 2008. Upgrading Brazil’s traceability. Meat International, Vol. 14, 4: 18-20.
- McNamara, Dr. A. M. and J.Jr. Williams, 2010. Food safety due diligence. Meat and Poultry, Vol. 49, 10: 56-62.
- Мое, Т., 1998. Perspectives on traceability in food manufacture. Trends in Food Science and Technology, 9: 211-214.
- Porter, C., 2012. Safety of meat products. Meat International, Vol. 12, 6: 12-15.
- Recommended International Code of Practice General Principles of Food Hygiene CAC/RCP 1-1969, Rev. 3/2009, Amd. (2010).
- Savage, R., 2008. Is your HACCP plan validated? Meat and Poultry, Vol. 48, 10: 56-58.
(Visited 146 times, 1 visits today)

This work is licensed under a Creative Commons Attribution 4.0 International License.


