

Manuscript accepted on : 30 July 2015
Published online on: --
Mathews P. Raj1* and Nalini Satishchandra2
1Department of Life Sciences, Jain University, Bangalore, India.
2Sri Bhagawan Mahaveer Jain College, Jayanagar, Bangalore, India.
DOI : http://dx.doi.org/10.13005/bbra/2200

ABSTRACT: Bangalore is a metropolitan and capital city of the state of Karnataka in India, it is considered to be the fastest growing Information technology and Biotechnology hub of the world. In contrast with the same the city is subjected to continuous development through anthropogenic activities where in it has lost most of its wetlands like lakes and the existing water bodies are exploited to the highest order the resultant of which is seen through the spread of diseases and loss of existing natural aquatic bodies and loss of ecosystem. In the present study grab water samples were collected from three distinct sampling stations of Mallathahalli Lake, Bangalore, India and assessed for various physical and chemical parameters betwixt December 2014 and February 2015; Microbiological evaluation was also extrapolated for the lake betwixt the same period. The average values recorded for the physical parameters like pH and temperature for Recycled, Open and Eutrophicated lake water was found to be within the limit. The average values recorded for the chemical parameters from the three sampling stations were found to be within the standards set by World Health Organization (WHO) for drinking water quality. The DO, BOD and COD values were found to be varying in the three different sampling stations implicating organic pollution. Bacteriological examination of water indicated high microbial activity and proved water to be unfit for human consumption. The effect of the water quality was supported by heart beat count and acetyl choline esterase activity which was established in zebra fish a vertebrate model. Zebra fish analysis concluded recycled water to be of better quality when compared to eutrophicated and open water system.
KEYWORDS: Mallathahalli Lake; Zebra fish; Danio rerio; Acetyl choline esterase activity; heartbeat count
Download this article as:| Copy the following to cite this article: Raj M. P, Satishchandra N. Physico-chemical and Microbiological Characterization of Recycled, Open and Eutrophicated Lake Water Grabs and Assessment of its Effects on A Vertebrate System Zebra Fish (Danio rerio): A Case Study of Mallathahalli Lake, Bangalore, India. Biosci Biotech Res Asia 2015;12(spl.edn.2) |
| Copy the following to cite this URL: Raj M. P, Satishchandra N. Physico-chemical and Microbiological Characterization of Recycled, Open and Eutrophicated Lake Water Grabs and Assessment of its Effects on A Vertebrate System Zebra Fish (Danio rerio): A Case Study of Mallathahalli Lake, Bangalore, India. Biosci Biotech Res Asia 2015;12(spl.edn.2). Available from:https://www.biotech-asia.org/?p=12903 |
Introduction
Wetlands play an important role in survival of life forms on planet earth and they are a pivotal source of water. Water is one of the basic amenities for survival of fauna and flora; lakes, estuaries, rivers etc form an integral part of wetland ecosystem. Lentic ecosystems especially lakes are the most productive ecosystems of the biosphere and they are constantly deteriorated by chemical pollution and anthropogenic activities; this haslead to loss of ecosystem and reduced socio-economic development (Constanza 1997, Rapport et al., 1998). The lakes occupied about 4.8% of geographical area of Bangalore and served as the major water source for drinking and irrigation (Ramachandra et al., 2001), The wetlands account for drinking water, fish culture, replenish ground water and also reduce natural calamities (Gurunathan 2006), Human activities has led to loss of wetlands the resultant of which is discontinuation of drainage networks in the city of Bangalore (Deepa et al., 1998) and the surviving lakes are reduced to cesspools due to continuous exploitation and dumping of waste (Ramachandra 2007). High pH, TDS, Sulphates and Phosphates has altered the nutrient concentration of the lakes in Bangalore and reduced the dissolved oxygen levels in the lakes leading to fish mortality (Zutshi et al., 2008). Fish death and sewage disposal has increased the microbial population resulting in diseases and infections. According to APHA (1992) pathogenic organisms transmitted through water are Salmonella, Klebsiella, E.coli, Shigella etc. Microbial population cause spoilage of fish after its death and also results in its decomposition (Nandini 1995).Water clogging inside water distribution system results in formation of bio-films and may result in spread of disease (Lee et al., 2010). The chemical pollutants and microbial population has largely deteriorated the water quality which in turn has influenced the composition, distribution and abundance of macro invertebrates and vertebrates (Zutshi et al., 2007), unplanned development of the city, industrial and domestic wastes, autochthonous wastes mainly due to plants have a direct effect on the water quality, influencing the light penetration and efficacy of the lakes (Ramachandra 2009). Ecological succession and growth of water weeds is the result of eutrophication observed in ibalur lake, Bangalore (Raj et al., 2014). Mallathahalli lake water was hard water type and can be used for irrigation (Ravikumar et al., 2013). Wetland ecosystems like lakes in Bangalore are largely degraded by pollutants and urbanization, with this ideology the objective of the study was to assess Mallathahalli Lake for physico-chemical characters and microbial characters and to evaluate its effects on zebra fish (Daniorerio) a vertebrate model.
Materials and Methods
Sampling station- Mallathahalli Lake
Mallathahalli Lake is a natural fresh water lake which is positioned at latitude of 12.9603 and a longitude of 77.4967, it is situated about 14 kilometres from the Kempegowda bus terminus and categorised under the south ward of urban Bangalore, India. The lake has a periphery of about 3.5 kilometres with a catchment area of 625 hectares; the lake was recouped in recent years for recreational purpose by bunds and fencing. Million litres per Day – Sewage Treatment Plant (MLD-STP) was set up to treat sewage water. The lake is bordered by a crematorium to the south, areca plantation to the west, a sewage treatment plant to the north and it is encroached by houses to the east. Three sampling stations were identified to collect water samples. Sample A- Recycler was a point near MLD-STP, at this point sewage water was recycled and ingested into the lake, Sample B-Boat camp was the second sampling station and this area was of the open water system thereby was well aerated and received good sunlight. Sample C- Plant was the site where in plants was found growing along with algal forms indicating high degree of eutrophication.
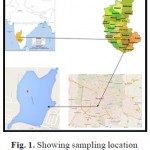 |
Figure 1: Showing sampling location Mallathahalli like in Bangalore, India.
|
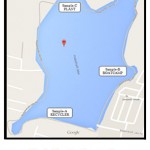 |
Figure 2: Showing the sampling stations in Mallathahali Indore
|
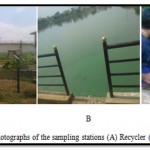 |
Figure 3: Showing the photographs of the sampling station (A) Recycler (B) Boat Camp (c) Plant
|
Sampling method
Physico chemical and Microbial characterization
BOD bottles and well cleaned plastic bottles were used to collect water samples from the sampling stations betwixt December 2014 and February 2015. Dissolved oxygen was fixed at the site, pH and temperature was determined at the sampling stations. Standard procedures prescribed in NEERI lab manual by Trivedi and Goel (1986) and APHA (1998) were used to judge the parameters like DO, BOD, COD, Sulphates, Calcium, Alkalinity, Ammonical nitrogen, Turbidity, Sodium and Potassium. Standard methods prescribed in lab manual of Aneja (2003) was followed to determine microbial parameters like most probable number (MPN) and total microbial counts.
Zebra fish (Daniorerio) examination
Fully developed breeding stock of zebra fish were procured form local aquarium vendors and grown for a week in small glass tanks fitted with a sieve at the bottom. The tanks were well aerated and lit. The fishes were fed with flakes twice a day and were allowed to fertilize. Spawning happened early in the morning and the eggs were trapped in the sieve which was further transferred to petriplates containing reverse osmosis water and the lake water samples to establish morphological changes and heart beat count of the embryos to correlate their growth and development.
Assay for Acetyl choline esterase activity
Titrimetric method for acetylcholine esterase activity (Guruprasad et al., 2014) was followed. Adult male fishes which were grown in the lake water samples was subjected to euthanization to dissect out the brain cells, the brain cells were homogenized with phosphate buffer in a pre-chilled mortar using the pestle. The homogenate was centrifuged with phosphate buffer at 4° C and the supernatant served to be the enzyme source. The supernatant was diluted to 20X strength for further assay. The diluted enzyme solution was mixed with acetylcholine iodide and titrated with sodium hydroxide with phenolphthalein as the indicator.
Results and Discussion
The lake water was analysed in three different sampling stations betwixt December 2014 and February 2015. The data for various physical and chemical parameters measured are tabulated. The data for Sample A – Recycler over the three sampling seasons is recorded in table 1. Similarly the data for the sample B- Boat camp and sample C- Plant are recorded in table 2 and 3 respectively. The microbial parameters which were examined are also recorded and indicated in table 5 and 6 respectively. The zebra fish analysis which was carried out to determine the effects on a biotic system are tabulated in table 7 and 8.
Table 1: indicating the Physico-Chemical parameters for the grab sample A – Recycler for the month of December 2014, January and February 2015
| Sl
No. |
Physico-chemical Parameter | World Health Organization (WHO) Standards | Grab 1- Recycler
Dec-2015 |
Grab 1- Recycler
Jan -2015 |
Grab 1- Recycler
Feb-2015 |
Average
Values for Recycler |
Standard deviation
For Recycler |
| 1 | pH | 6.5-8.5 | 7.6 | 7.6 | 7.4 | 7.533 | 0.11547 |
| 2 | Temperature | – | 22 | 21 | 24 | 22.333 | 1.527525 |
| 3 | DO | 5.0 | 5.8,5.2 | 4.8,3.2 | 3.2,2.4 | ||
| 4 | BOD | 28.30 | 0.6 | 1.6 | 0.8 | 1 | 0.52915 |
| 5 | COD | 10 | 68 | 73.0 | 73.6 | 71.533 | 3.0746 |
| 6 | Calcium | 75-200 | 64 | 62 | 66 | 64 | 2 |
| 7 | Sulphates | 42-45 | 4 | 1.2 | 0.65 | 1.95 | 1.796524 |
| 8 | Total alkalinity | 200 | 140 | 95 | 95 | 110 | 25.98076 |
| a. | Hydroxide alkalinity | 0 | 0 | 0 | 0 | 0 | 0 |
| b. | Carbonate alkalinity | – | 16 | 10 | 10 | 12 | 3.464102 |
| c. | Bicarbonate alkalinity | – | 140 | 85 | 85 | 103.333 | 31.75426 |
| 9 | Turbidity | 5 NTU | 1.5 | 1.5 | 1.5 | 1.5 | 0 |
| 10 | Sodium | 200 | 48 | 46 | 48.5 | 47.5 | 1.322876 |
| 11 | Potassium | – | 5 | 6 | 5 | 5.3333 | 0.57735 |
| 12 | Ammonical nitrogen | 50 | <1 | <1 | <1 | <1 |
Table 2: indicating the Physico-Chemical parameters for the grab sample B – Boat Camp for the month of December 2014, January and February 2015
| Sl
No. |
Physico-chemical Parameter | World Health Organization (WHO) Standards | Grab 2- Boat Camp
Dec-2015 |
Grab 2- Boat Camp
Jan -2015 |
Grab 2- Boat Camp
Feb-2015 |
Average
Values for Boat Camp |
Standard deviation
For Boat Camp |
| 1 | pH | 6.5-8.5 | 7.2 | 7.3 | 7.3 | 7.266667 | 0.057735 |
| 2 | Temperature | – | 21 | 22 | 24 | 22.33333 | 1.527525 |
| 3 | DO | 5.0 | 5.2,4.9 | 4.7,2.9 | 4.8,1.6 | ||
| 4 | BOD | 28.30 | 0.3 | 1.8 | 3.2 | 1.766667 | 1.450287 |
| 5 | COD | 10 | 435 | 430 | 441.6 | 435.5333 | 5.818362 |
| 6 | Calcium | 75-200 | 82 | 84 | 86 | 84 | 2 |
| 7 | Sulphates | 42-45 | 40 | 34 | 35 | 36.33333 | 3.21455 |
| 8 | Total alkalinity | 200 | 152 | 155 | 155 | 154 | 1.732051 |
| a. | Hydroxide alkalinity | 0 | 0 | 0 | 0 | 0 | 0 |
| b. | Carbonate alkalinity | – | 14 | 10 | 10 | 11.33333 | 2.309401 |
| c. | Bicarbonate alkalinity | – | 152 | 145 | 145 | 147.3333 | 4.041452 |
| 9 | Turbidity | 5 NTU | 31.0 | 31.0 | 31.0 | 31 | 0 |
| 10 | Sodium | 200 | 70 | 73 | 70.1 | 71.03333 | 1.703917 |
| 11 | Potassium | – | 9 | 8 | 8 | 8.333333 | 0.57735 |
| 12 | Ammonical nitrogen | 50 | <1 | <1 | <1 |
Table 3: indicating the Physico-Chemical parameters for the grab sample C – Plant for the month of December 2014, January and February 2015
| Sl
No. |
Physico-chemical Parameter | World Health Organization (WHO) Standards | Grab 3- Plant
Dec-2015 |
Grab 3- Plant
Jan -2015 |
Grab 3- Plant
Feb-2015 |
Average
Values for Plant |
Standard deviation
For Plant |
| 1 | pH | 6.5-8.5 | 7.2 | 7.1 | 7.1 | 7.133333 | 0.057735 |
| 2 | Temperature | – | 21 | 22 | 25 | 22.66667 | 2.081666 |
| 3 | DO | 5.0 | 2.3,2.1 | 2.5,2.2 | 1.6,1.6 | ||
| 4 | BOD | 28.30 | 0.2 | 0.3 | 0 | 0.166667 | 0.152753 |
| 5 | COD | 10 | 142 | 145 | 140 | 142.3333 | 2.516611 |
| 6 | Calcium | 75-200 | 74 | 79 | 74 | 75.66667 | 2.886751 |
| 7 | Sulphates | 42-45 | 12 | 12 | 13.4 | 12.46667 | 0.80829 |
| 8 | Total alkalinity | 200 | 150 | 145 | 145 | 146.6667 | 2.886751 |
| a. | Hydroxide alkalinity | 0 | 0 | 0 | 0 | 0 | 0 |
| b. | Carbonate alkalinity | – | 16 | 10 | 10 | 12 | 3.464102 |
| c. | Bicarbonate alkalinity | – | 150 | 135 | 135 | 140 | 8.660254 |
| 9 | Turbidity | 5 NTU | 6 | 6 | 6 | 6 | 0 |
| 10 | Sodium | 200 | 92 | 96 | 100 | 96 | 4 |
| 11 | Potassium | – | 9 | 12 | 9 | 10 | 1.732051 |
| 12 | Ammonical nitrogen | 50 | <1 | <1 | <1 |
Table 4: indicating the average values ofPhysico-Chemical parameters for the grab samples A- Recycler, B- Boat Camp and C- Plant the month of December 2014, January and February 2015
| Sl
No. |
Physico-chemical Parameter | World Health Organization (WHO) Standards | Average of Grab 1 – Recycler
|
Average Grab 2- Boat Camp
|
Average of Grab 3 – Plant | Average
Values |
Standard deviation
|
| 1 | pH | 6.5-8.5 | 7.533 | 7.2666 | 7.13333 | 7.310977 | 0.203497 |
| 2 | Temperature | – | 22.333 | 22.333 | 22.6666 | 22.4442 | 0.192604 |
| 3 | DO | 5.0 | |||||
| 4 | BOD | 28.30 | 1 | 1.7666 | 0.16666 | 0.977753 | 0.800202 |
| 5 | COD | 10 | 71.533 | 435.53 | 142.333 | 216.4653 | 192.99 |
| 6 | Calcium | 75-200 | 64 | 84 | 75.6666 | 74.55553 | 10.04619 |
| 7 | Sulphates | 42-45 | 1.95 | 36.333 | 12.4666 | 16.91653 | 17.61815 |
| 8 | Total alkalinity | 200 | 110 | 154 | 146.666 | 136.8887 | 23.57323 |
| a. | Hydroxide alkalinity | 0 | 0 | 0 | 0 | 0 | 0 |
| b. | Carbonate alkalinity | – |
12 |
11.333 | 12 | 11.77767 | 0.385093 |
| c. | Bicarbonate alkalinity | – |
103.333 |
147.33 | 140 | 130.22 | 23.57406 |
| 9 | Turbidity | 5 NTU | 1.5 | 31 | 6 | 12.83333 | 15.89287 |
| 10 | Sodium | 200 | 47.5 | 71.033 | 96 | 71.511 | 24.25353 |
| 11 | Potassium | – | 5.3333 | 8.3333 | 10 | 7.888767 | 2.365043 |
| 12 | Ammonical nitrogen | 50 |
<1 |
<1 | <1 | 1 | 0 |
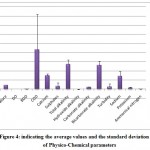 |
Figure 4: Indicating the average values and the standard deviation of Physico-Chemical parameters
|
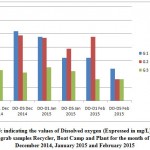 |
Figure 5: Indicating the values of Dissolved oxygen (Expressed in mg/L) for the grab samples Recycler, Boat Camp and Plant for the month of December 2014, January 2015 and February 2015.
|
The pH of the lake water was found to be 7.31, the average pH value of the Recycler, Boat camp and Plant was found to be 7.53, 7.26 and 7.13 respectively. High pH imparts a bitter taste to the water and may also corrode water distribution system. A pH range of 6-9 is expected for survival of aquatic life failing which there is slow deterioration of life forms (Alabaster et al., 1980). Temperature of lake water is dependent on the dissolved oxygen (Salah 2014); higher temperature will result in chemical reactions. The mean values of temperature were found to be 22.33 samples A and B and 22.66 for sample C respectively. Dissolved oxygen is supposed to be 5mg/L for ecological sustenance (Ramachandra et al., 2001) below which it may lead to stress in survival (Sisodiya et al., 2006). The DO values for day 1 and day 5 observed is depicted in figure 5. Sample C- Plant showed a very low DO level. Highest DO recorded was 2.3 and the lowest was 1.6. These DO values indicated are below the WHO standards for the sample C which also proves stress conditions for survival of aquatic life. BOD is the oxygen requirement for breakdown of organic compounds, low BOD indicates good water quality and high BOD indicates water quality to be poor and affects the survival of aquatic life (Shelton 1991). If BOD is less than 3 mg/L then water is considered to be good. 1, 1.76 and 0.16 are the BOD values observed for the three sampling zones which indicate Mallathahalli lake water to be good. COD is a parameter which is reliable to measure the organic pollution of wetlands (Amirkolaie 2008). Table 1, 2 and 3 indicates the values of COD for the three sampling points. 216.46 is the average value of COD observed which is indicated in table 4. The values indicated for COD in the above tables exceeded the WHO standards and imply that the lake water has a very high organic pollution affecting the survival and metabolism of aquatic life. Calcium is an essential nutrient required by water dwelling organisms; 74.55 mg/L was found to be the average value of calcium in the lake which is found to be within the WHO standard. 1.95, 36.333 and 12.46 mg/L were the mean values of sulphate for the three samples respectively with 16.91mg/L to be the overall concentration in the lake which was found to be within the standard. Alkalinity is said to increase with pH and chemical pollutants, the lake water showed a value of 136.88 mg/L. The average values of the sampling zones are indicated in table 1, 2 and 3 respectively. The lake water was found to be within the acceptable range and proved to be good. Clay, silt, organic pollution, phytoplankton may lead to turbidity of water (kishore et al., 2005). 1.5 NTU, 31 NTU, and 6 NTU are the values of the three sampling stations as indicated in table 4. This indicates Sample B to be highly turbid. Ground water contains high sodium depositions when compared to surface waters (WHO 1979). 47.5mg/l, 71.03 mg/l and 96 mg/l were the observed values of sodium in the sampling points Recycler, Boat camp and Plant respectively, these values clearly depict that the sample B and sample C have crossed the permissible limit. Migratory ability of potassium is inadequate because of which it found to be in very low concentration in surface waters. 7.88mg/L is the average value of potassium observed in the lake. The individual values the three sampling wings are tabulated in table 1, 2, 3 and 4. Ammonical nitrogen observed in the lake is negligible.Based on the physico-chemical parameters Mallathahalli Lake water is found to be of good quality for drinking and irrigation. Sampling point A- recycler where in the MLD-STP is stationed was found to be better when compared to sample B- Boat camp that is the open water system and sample C-Plant. Sample C was found to poor due to organic waste and eutrophication.
Table 5: indicating the Most Probable Number results for the grab samples (Recycler, Boat Camp and Plant) for the month of December 2014, January and February 2015
| Sampling site | Month | Number of tubes showing positive results | MPN index per 100 ml | ||
| 3 out of 10 ml | 3 out of 1ml | 3 out of 0.1 ml | |||
| Sample A- Recycler | December 2014 | 3 | 3 | 3 | 2400 |
| January 2015 | 3 | 3 | 3 | 2400 | |
| February 2015 | 3 | 3 | 3 | 2400 | |
| Sample B- Boat camp | December 2014 | 3 | 3 | 3 | 2400 |
| January 2015 | 3 | 3 | 3 | 2400 | |
| February 2015 | 3 | 3 | 3 | 2400 | |
|
Sample C- Plant |
December 2014 | 3 | 3 | 3 | 2400 |
| January 2015 | 3 | 3 | 3 | 2400 | |
| February 2015 | 3 | 3 | 3 | 2400 | |
The MPN analysis carried out from the three sampling stations showed a very high microbial population, the MPN tubes showed acid and gas formation in all the lactose fermentation tubes which is depicted in figure 6; 2400 microorganisms were found to be present in 1ml of the water sample. Water samples from the positive tubes were inoculated onto EMB agar and this confirmed the presence of faecal contaminants especially E.coliwhich was confirmed through green metallic sheen on the EMB media. This is depicted in figure 7.
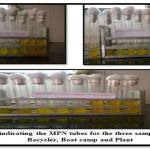 |
Figure 6: Indicating the MPN tubes for the three sampling stations recycler, boat camp and plant
|
The colony characteristics were determined and the same is recorded in table 6. Gram positive rods, gram positive cocci, gram positive rods with endospores and gram negative
rods were observed in the three sampling wings. Gram positive cocci in clusters and gram positive cocci in chains were noticed in sampling point B and C. The microbial examination of the three sampling stations implies that the lake water is poor and unfit for drinking.
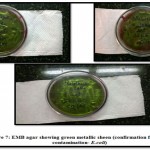 |
Figure 7: EMB agar showing green mrtallic sheen (confirmation for faecal contamination- E.coli)
|
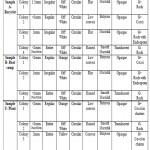 |
Table 6: indicating the colony characters and the gram characteristics of isolated microorganisms.
|
The effects of the lake water on a biotic system carried out on zebra fish embryos and adult zebra fish showed variations with respect to heart beat count and external morphology of the embryos. The heart beat count recorded is tabulated in table 7; these values indicate that the heart beat recorded in sample A is proximate to the control set up stipulating good water quality; Whereas the sample B showed deviation from the control indicating poor water quality. Sample C- Plant showed 70 heart beats per minute which is almost half of the control value connoting water quality to be bad.
Table 7: indicating the Heart Beat count recorded in Zebra fish (Daniorerio) for the samples Recycler, Boat Camp and Plant
| Serial number | Analyte | Heart Beat Recorded |
| 1. | Control | 145/minute |
| 2. | Test 1- Recycler | 148/minute |
| 3. | Test 2- Boat Camp | 110/minute |
| 4. | Test 3- Plant | 70/minute |
Table 8: indicating the Acetyl choline esterase activity recorded in Zebra fish (Daniorerio) for the samples Recycler, Boat Camp and Plant
| Serial number | Analyte | Acetyl choline esterase activity |
| 1. | Control | 1.7934 micromoles /minute |
| 2. | Test 1- Recycler | 1.6943 micromoles /minute |
| 3. | Test 2- Boat Camp | 1.9878 micromoles /minute |
| 4. | Test 3- Plant | 2.8246 micromoles /minute |
A very high enzyme activity was observed for sample C-Plant when compared to the control set up. This implies that the neurotransmitter acetylcholine was degraded at a faster rate by the enzyme making the survival of life forms stressful.
Conclusion
The physico-chemical analysis of Mallathahalli Lake holds good for the adjudged parameters except DO and COD. Based on the same water can be used for human activities, the microbial examination clearly indicates water sample from the lake is completely unfit for human consumption. The evidence of heart beat count and acetylcholine esterase activity indicated that water quality is poor for survival of aquatic life because of stressed environment noticed in sampling station B and C. The recycled lake water (Sample A) was found to be good for biotic life and also gives us clarity that lake water can be monitored by stationing MLD-STP. Proper maintenanceof the lake will help us in conservation of the lake, which in turn helps to replenish ground water and also preserves an ecosystem. Similar studies will create awareness about the wetlands especially lakes amidst the society. Educating the society on the same will help in long term existence of the lakes and also helps in homeostatic mechanism of planet earth for the better survival of the human race.
References
- Alabaster JS, Lloyd R Water quality criteria for freshwater fish. European Inland Fisheries Advisory Commission Report (FAO). Buttersworth, London-Bostonn 1980;pp 297
- American Public Health Association. Standard Methods for the Examination of Water and Wastewater. 20th edition, APHA, New York.1998.
- Amirkolaie AK. Journal of Fish Aquatic Science, 2008; Vol 3, pp 275-279
- Aneja KR. Experiments in Microbiology, Plant pathology, Tissue Culture and Mushroom production technology, Edition IV, New age International publications, New Delhi.2003
- APHA, AWWA and WPCF, standard methods for examination of water and wastewater, 19th1992.
- BelaZutshi, Raghu Prasad S.G, Nagaraja R. Anthropogenic Impact on the lake Ecosystems in the Hitech city of Bangalore,Karnataka, Proceedings of Taal: The 12th World lake conference. 2007; pp1786-1793
- Constanza R, Darge R, Degroot R. The values of the world’s ecosystem services and natural capital. Nature 387,1997;pp 253–260
- DeepaRS,Ramachandra TV, Kiran R. Anthropogenic stress in wetlands of Bangalore. Proceedings of the national conference on environmental pollution: causes and Remedies,1998;pp:195-212
- Gurunathan A, Shanmugam CR. Customary Rights and their Relevance in Modern Tank Management: Select Cases in Tamil Nadu. International Environmental Law Research Centre (ILERC).2006.
- Jayanth A, Guruprasad R. Assay of acetylcholine esterase enzyme activity by titrimetric method. International journal of Pharma and Bio sciences 2014; 5(4): pp.643 – 647
- Kishor K, Joshi BDD. Himalayan journal of environmental zoology, 2005; 19: 89-92
- Lee J, Lee CS,Hugunin KM, Maute CJ, Dysko RC. Bacteria from drinking water supply and their fate in gastrointestinal tracts of germ-free mice: A Phylogenetic comparison study. Water Research 2010; 44 : 5050 – 5058
- Mathews P Raj, SandhyaPanicker Quantification of the Flora and the Study of Ecological Succession at Ibalur Lake, Bangalore Using Sequential Aerial Photography. Research Journal of Pharmaceutical, Biological and Chemical Sciences 2014; 5(3) Page No. 2114
- Nandini N Pollution indicator bacteria in intestinal tract of fish; Print media; Bangalore.1995.
- RamachandraTV, Ahalya N. Monograph on Essentials in Limnology and GIS. Karnataka Environment Research Foundation, Bangalore.2001.
- Ramchandra TV, Malvikaa S. Ecological assessment of lentic water bodies in Bangalore.technical report 25. 2007http://wgbis.ces.iisc.ernet.in/energy/water/paper/ETR25
- Ramachandra TV. Essentials in urban lake monitoring and management, CiSTUP.Technical report 1, Urban Ecology, Environment and Policy Research, Centre for Infrastructure, sustainable transportation and Urban Planning, IISc, Bangalore.2009.
- Rapport DJ, Costanza R, McMichael AJ. Assessing ecosystem health trends Ecology and Evolution.1998; 13 (10), 397–402
- Ravikumar P, AneesulMehmood, Somashekar RK. Water quality index to determine the surface water quality of Sankey tank and Mallathahalli lake, Bangalore urban district, Karnataka, India, Applied Water Science, 2013; Volume 3, Issue 1, pp 247-261
- Salah EE, Abdul Ghafoor KF, Abdalwahab EM. Assessment of Pollution Level of Habbaniya Lake, Iraq using Organic Pollution Indicators. International Journal of Lakes and Rivers, 2014; 7: 25-36
- Sisodia R, Moundiotiya C. Assessment of the water quality index of Wetland kalakho lake, Rajasthan, India. Journal of Environmental Hydrology, 2006;14(23): 1-11
- Shelton T. Interpreting Drinking Water Quality Analysis-What do the numbers mean? New Brunswick, 5th Edition, the State University of New Jersy Rutgers. 1991; pp 5-9
- Trivedi RK, Goel P K. Chemical and biological methods for water pollution studies, Enviromedia, Karad, Maharastra, India.1986.
- World Health Organization (WHO). Sodium, Chlorides and conductivity in drinking water. Euro reports and studies, No 2. Copenhagen, Denmark: WHO regional office for Europe.

This work is licensed under a Creative Commons Attribution 4.0 International License.


