

Manuscript accepted on :
Published online on: 28-06-2013
A Simple Method to Map an Institutional Research landscape using Cytoscape
Anchalee Nirachanon and Duncan R. Smith*
Institute of Molecular Biosciences, Mahidol University, Salaya Campus, 25/25 Phuttamontol Sai 4, Salaya, Nakorn Pathom, Thailand 73170. Corresponding Author E- mail: duncan_r_smith@hotmail.com
DOI : http://dx.doi.org/10.13005/bbra/1096

ABSTRACT: Research institutions are organizations that are traditionally composed of a number of researchers either working independently or as part of small clusters (such as research groups) within the institute. While there are a number of methods to evaluate the contribution of individuals to the overall research productivity of an institute, these methods tend to be relatively static, and may fail to accurately represent the nature of the institution. This study describes the application of a well established biological interaction program, Cytoscape, to allow visualization of the interaction of the individual researchers and show that by weighting the information with collaborative link strengths and output data or citation data, it is able to produce a picture of the ‘research landscape’ of an institution. The data can be easily updated and can provide a continual picture of the activity of a research institute or other organization. In particular this system is adaptable to use without subscription to potentially expensive databases which may be unavailable to workers in smaller institutions or those in developing nations.
KEYWORDS: Citation analysis; collaboration; networking; output
Download this article as:| Copy the following to cite this article: Nirachanon A, Smith D. R. A Simple Method to Map an Institutional Research landscape using Cytoscape. Biosci Biotechnol Res Asia 2013;10(1) |
| Copy the following to cite this URL: Nirachanon A, Smith D. R. A Simple Method to Map an Institutional Research landscape using Cytoscape. Biosci Biotechnol Res Asia 2013;10(1). Available from:https://www.biotech-asia.org/? p=9938 |
Introduction
Evaluation of research productivity, whether of the individual, the department, faculty or institute or of the University itself is an established part of research culture. At the University level, evaluation of research productivity is normally related to “benchmarking” and occurs at both the national and international levels (1). Within the University organization, evaluation of research productivity for departments, faculties and institutions may be used for benchmarking purposes, but may more frequently be used for the allocation of funds and/or space (2). Evaluation of the research productivity of the individual will have an element of benchmarking and fund or space allocation, but will additionally help determine personal researcher benefits such as salary increases and promotion (3).
There are several well reported methods of evaluation, all of which have their own particular advantages and disadvantages. These methods are primarily retrospective in methodology (4), and involve determination of output in terms of simple paper number counts, published pages, fractional paper counts (where author credit is assigned as a fraction of the total number of authors on a paper) or the use of bibliographic citation analysis either by direct citation counts, average citation counts or more recently by h factor analysis (5). Whichever method is used, the final result is normally a number that needs to be further interpreted in light of other factors such as the seniority of the researcher.
More importantly, research organizations (department, faculty or institute) are interactive organizations, and the researchers within the organization will be linked by internal collaboration and multiple authors may be present on multiple papers that contribute to the total institute output, in this regard the sum of all individual publications will be higher than the total institute output. The use of fractional paper counts serves to account for this by proportioning output amongst contributing authors. Understanding the interactive organization of the research institute is therefore a more difficult task than simply evaluating individuals, but may allow an understanding of how inter-related individuals contribute to the total research output of an institute. This study therefore sought to see if it was possible to produce an easily updatable visual map of the research landscape of a research institute using relatively simple data analysis tools that do not require extensive computer expertise, based on publication records. In particular the study aimed to use a program that is freely available, and one in which the analysis could, if required, be undertaken without paid subscription to databases.
As a proof of principle study, the research output from the Institute of Molecular Biosciences, Mahidol University, Thailand was analyzed. This Institute was formed in 2009 by the merger of two existing institutes within Mahidol University, Thailand and consists of approximately 60 staff members divided into individual laboratories and research centers. The output of the institute during its life span to date was determined by a search of the Elsevier SciVerse Scopus database, and the data analyzed in terms of individual output and collaborative links using the Cytoscape program (6). Cytoscape is an open source bioinformatics program for the visualization, integration and analysis of network data. Cytoscape currently consists of a basic core module for which a large number of plugins suited to specific purposes have been developed, and while the primary use of Cytoscape is visualization of complex biological networks, such as gene or protein interaction networks, the program also has applications in social network analysis (http://www.cytoscape.org/). Although in this study the core data was generated through the Elsevier SciVerse Scopus database, the data could easily be compiled through the institutes own records.
Methods
Data on publications of the Institute of Molecular Biosciences, Mahidol University Thailand was sourced from the Elsevier SciVerse Scopus database (http://www.scopus.com/home.url) on the 6 December 2012. The search criteria were the “Institute of Molecular Biosciences” [affiliation address] OR “Institute of Molecular Bioscience” [affiliation address] AND “Mahidol’ [affiliation address]. A total of 223 documents were identified and the entries (citations only, which includes information on: author(s), document title, year, source title, volume, issue, pages, citation count and source and document type) were downloaded as a comma separated file (.csv) file. The file was manually curated to exclude 7 conference papers, 1 paper wrongly assigned (from a paper with an author from the “Institute of Molecular Biosciences” Massey University, New Zealand collaborating with an author from a different Mahidol University institution), 3 published erratum and 3 papers with no institute staff member (these papers originated from students of the Institute of Molecular Biosciences, Mahidol University who were on overseas attachments). The final list of entries consisted of 209 primary publication documents by directly employed and affiliated staff of the institute. Citation data was determined on 14 May 2013 from the Elsevier SciVerse Scopus database.
Institute authors were identified in the downloaded .csv file by searching against the full list of Institute staff members (both permanent and affiliated staff). To provide a weighted analysis, each author was assigned a fractional number based on the number of Institute authors on the paper. Thus a paper with two institute authors would result in each author getting 0.5 publication points and so on. In the weighted analysis an author will receive one publication point if they were the only Institute author on the paper.
Results and Discussion
Data on publications from the Institute of Molecular Biosciences, Mahidol University, Thailand was downloaded from Scopus in the format of a comma separated file (.csv) which was subsequently accessed with the Microsoft Excel program. After manual curation, institute authors were identified on each publication. Each paper was thus identified as being the work of a single institute author or as a result of collaboration between authors of the institute. This data was entered into a Microsoft Excel file, where all authorship pairs were detailed and authors who had published at least one paper with no other institute author were added to the file as unpaired entries. In addition a second Microsoft Excel file was created where each authorship entry (single or multiple) was assigned an authorship fraction with 1 for sole institute author (but not necessarily the sole author) and proportionate fractions for multiple institute authorships. The linkage file was accessed using Cytoscape (6) using the option to “import a network from a Table (Text/MS Excel)”. The initial output is relatively uninformative, but this can easily be re-arranged by directly moving the nodes with the mouse to better visualize the linkages. The output at this stage represents a picture of the collaborative links between individuals, as attested by publications, with unlinked authors represented as unlinked single nodes. The output was further modified by manually editing the linkages and nodes through the visual mapping bypass option to add further information. In the example shown in Figure 1, information on academic position (node colour), number of collaborative articles (line width) and fractional paper count for each author (node size) has been added to the output, providing a visualization of the research landscape of the Institute. In this output, the sum of all node sizes directly represents the complete Institute output, and node sizes are strictly proportional to contribution to the made to the total output by the individual authors. Using this methodology, centers of “research gravity” can easily be identified, and the contribution of authors to the overall output of the institute intuitively grasped. It needs to be noted however that individuals who have no published output are not represented in the final figure. In addition, other factors such as teaching load, patents, books and other output that may have an important bearing on an individual’s personal productivity are not reflected in this analysis.
In a subsequent analysis citation data for the papers in the study was accessed on 14 May 2013 from Scopus. A total of 941 citations of the 209 papers were found in this database, giving an average citation rate of approximately 4.5 citations per paper (range 0 to 68). However, 53 of the papers had no citations to date. A citation map was produced using Cytoscape in which only cited papers were included, with line weighting representing the number of cited papers shared between institute authors, and node size representing citation share, in which the number of citations were divided between the authors of the papers and node colour representing position (Figure 2). Broadly speaking while Figure 1 shows output, Figure 2 is representative of the impact of that output.
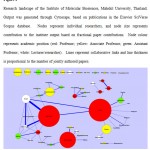 |
Figure 1: Research landscape of the Institute of Molecular Biosiences, Mahidol University, Thailand. Output was generated through Cytoscape, based on publications in the Elsevier SciVerse Scopus database. Nodes represent individual researchers, and node size represents contribution to the institute output based on fractional paper contributions. Node colour represents academic position (red: Professor; yellow: Associate Professor; green: Assistant Professor; white: Lecturer/researcher). Lines represent collaborative links and line thickness is proportional to the number of jointly authored papers. |
While there are currently a number of methods for determining research contribution of either individuals at the level of the institute or university, or for determining the contribution of institutions at the national and international levels, many of these require complex formula, or extensive computing or computer language knowledge. The method presented in this work requires no advanced computer knowledge, or mathematical expertise, and the output can be easily understood by non-specialists. More importantly, without a requirement for complex mathematics or computer expertise, the output can be generated by non-technical staff.
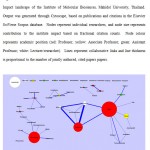 |
Figure 2: Impact landscape of the Institute of Molecular Biosiences, Mahidol University, Thailand. Output was generated through Cytoscape, based on publications and citations in the Elsevier SciVerse Scopus database. Nodes represent individual researchers, and node size represents contribution to the institute impact based on fractional citation counts. Node colour represents academic position (red: Professor; yellow: Associate Professor; green: Assistant Professor; white: Lecturer/researcher). Lines represent collaborative links and line thickness is proportional to the number of jointly authored, cited papers papers. |
Although our proof of principal analysis only analyzed slightly over 200 papers, Cytoscape is capable of handling many thousands of linkages (6) and as such the analysis is applicable to institutions of any size. Currently the main limitation is on the initial data entry to the Excel file, but importantly, once the data is entered the analysis can be easily updated by adding new authors and/or linkages. While this form of analysis may not replace formal mathematical analyses, the generation of a simple, easily understood picture of the research landscape of an Institute suggests that this methodology may have future value as an additional analytic tool which may complement existing methods of researcher evaluation.
Funding
This work was supported by Mahidol University.
References
- Sharif, M.N. Measurement of technology for national development. Technol. Forecast. Soc., 1986; 29, 119-172.
- Iyengar, R., Wang, Y., Chow, J., Charney, D.S. An integrated approach to evaluate faculty members’ research performance. Acad. Med., 2009; 84 (11), 1610-6.
- Reskin, B.F. Scientific productivity and the reward structure of science. Am. Sociol. Rev., 1977; 42, 491-504.
- Avital, M., Collopy, F. Assessing research performance: Implications for selection and motivation. Case Western Reserve University, USA. Sprouts: Working papers on information systems. 2001. Retrieved 7 march 2011, from http://sprouts.aisnet.org/1-14/.
- Hirsch, J.E. An index to quantify an individual’s scientific research output. Proc. Nat. Acad. Sci. USA., 2005; 102 (46), 16569-72.
- Shannon, P., Markiel, A., Ozier, O., Baliga, N.S., Wang, J.T., Ramage, D., et al. (2003). Cytoscape: a software environment for integrated models of biomolecular interaction networks. Genome Res., 2003; 13 (11), 2498-504.

This work is licensed under a Creative Commons Attribution 4.0 International License.


