

Manuscript accepted on : 10 May 2018
Published online on: 15-06-2018
Effects of Adding Coated urea on In Vitro Gas Production of Dairy Cow
M. Mazinani1 , A. A. Naserian2, M. Danesh Mesgaran2 and R. Valizadeh2
1Ruminant Nutrition, Ferdowsi University of Mashhad, Mashhad, Iran.
2Department of Animal Sciences, Faculty of Agriculture, Ferdowsi University of Mashhad, Mashhad, Iran.
Corresponding Author E-mail: mitra_mazinani@yahoo.com
DOI : http://dx.doi.org/10.13005/bbra/2638

ABSTRACT: In this experiment the effects of different urea products (urea, Paraffin-sulfur Coated Urea (PSCU) and controlled release urea product (Optigen, Alltech Inc., Lexington, KY)) on rumen fermentation were investigated in dependence of different diet sources by using in vitro techniques. The experiment followed a completely randomized design using four N-source treatmentes (urea, Paraffin-sulfur Coated Urea, Optigen and canola meal) in four diets (wheat straw+ %3 isonitrogenous of each N-source, barley grain+ %3 isonitrogenous of each N-source, barley grain+ molasses+ %3 isonitrogenous of each N-source and formulated TMR diets for dairy cow+ %3 isonitrogenous), the cumulative gas production (96 hours) influenced by diets and N-source treatments was different, which was higher gas production in formulated TMR diets for dairy cow and least gas production in wheat straw. The result indicated that Optigen (90.82) and then PSCU (90.81) the highest gas producer in the formulated TMR diets for dairy cow and the canola meal (69.04) and urea (69.43) had the least gas production in wheat straw (P<005). As a result, little difference between treatments for slow-release urea with control (canola) was observed in animal experiments. And therefore reducing feed costs and increasing the efficiency of the rumen microorganisms can be used NPN sources as a replacement for part of dietary protein.
KEYWORDS: Coated Urea; Urea; N-Source; Optigen
Download this article as:| Copy the following to cite this article: Mazinani M, Naserian A. A, Mesgaran M. D, Valizadeh R. Effects of Adding Coated urea on In Vitro Gas Production of Dairy Cow. Biosci Biotech Res Asia 2018;15(2). |
| Copy the following to cite this URL: Mazinani M, Naserian A. A, Mesgaran M. D, Valizadeh R. Effects of Adding Coated urea on In Vitro Gas Production of Dairy Cow. Biosci Biotech Res Asia 2018;15(2). Available from: https://www.biotech-asia.org/?p=30085 |
Introduction
Urea is a small organic compound that is very rich in N (44.96% N) that is used to supply degradable intake protein (DIP) to ruminants, which is cost-saving as compared with true protein feeds (Pfeffer et al. 2009; Taylor-Edwards et al. 2009; Calsamiglia et al. 2010; Cherdthong and Wanapat 2011). However, the amount of urea that can be used is limited because of the rapid hydrolysis to ammonia (NH3) in the rumen (Galo et al. 2003; Golombeski et al. 2006).Urea is broken down to ammonia in the rumen under the action of bacterial urease (Satter and Slyter, 1974). Microorganisms in the rumen are able to utilize the resulting ammonia to form amino acids which then become available to the host when microbial bodies are digested and absorbed post ruminally (Loosli et al., 1949).
The reasons for using urea over other sources of DIP is that urea N is cheaper on a per N basis than any other feedstuff and transportation and storage are cheaper and easier due to the concentrated nature of urea (McPherson and Witt, 1968). However, urea is used rather inefficiently by ruminants compared with other sources that contain true protein (Broderick et al., 2009), and this is due to the fact that the rate at which urea is degraded in the rumen is more rapid than the rate of utilization of the resulting ammonia by rumen bacteria leading to ruminal accumulation and absorption of ammonia and subsequent excretion of urea in the urine (Golombeski et al., 2006; Highstreet et al., 2010). Therefore utilizing urea as a DIP source may lead to excessive excretion of N in the urine. Nitrogen excretion from cattle operations has become a matter of increasing public concern over the last decade (VandeHaar and St-Pierre, 2006) and therefore reducing N excretion from cattle operations has become an increasing priority for ruminant nutritionists. One strategy for improving the utilization of urea by ruminants is to more closely time the fermentation of energy and the availability of ammonia in the rumen (Johnson, 1976). This may be done by increasing the degradability of the carbohydrates in the diet, or alternatively, by reducing the degradation rate of urea. A number of slow release urea products have been developed for this purpose (Deyoe et al., 1968; Fonnesbeck et al., 1975; Owens et al., 1980). Therefore, the objectives of this study was to develop Paraffin-sulfur Coated Urea and determine this Effects on in vitro gas production of dairy cows.
Materials and Method
Coating Urea in Rotary Drum
A rotary drum coater was used to coat the urea particles. The rotary drum coater was made from stainless steel and was 50 cm in diameter. Urea granules with a nitrogen content of 46%, was previously sieved to 1 mm in diameter were weighed and fed into the rotary drum rotating at 12 rpm. The materials selected as coating mixture were paraffin and sulfur15:1. Coating mixture was frequently applied onto the surface of the tumbling urea. Coated particles were collected after 20 min for analysis. (international patent number: A01K5/00, inventor: Mitra Mazinani)
Evaluate the Kinetics of NH3-N release
NH3-N release of each Optigen and PSCU were tested in sex liquid phase included (distilled water, TCA (Ph = 6.2), buffer solution, buffered rumen fluid, Free cell rumen fluid (centrifugation at 7000 rpm), Free cell buffered rumen fluid). Each of the tow N-sources was isonitrogenous (equivalent 20mg urea) and added to a 100-ml glass syringe. Ruminal fluid was obtained from three ruminally-fistulated Holstein cows fed a similar SBM basal diet. Then 30 ml of solution (consisting distilled water, TCA, buffer solution, buffered rumen fluid, Free cell rumen fluid or Free cell buffered rumen fluid) were pipette into each syringe followed by incubation in a water bath at 39°C. Three syringes for each treatment diet were incubated. At 0, 30 min and 2, 4 and 6 h time points, the syringes were taken out and Residual solid part was taken for determination of NH3-N release using the Kjeldahl N methods (AOAC, 2005).
In vitro gas production: To determine the gas production of each N-Sources (four N-Sources in triplicate) was tested in 4 different feed mixtures (straw + 3% N-Sources, barley flour + 3% N-Sources, barley flour + molasses as additives + 3% N-Sources, a dairy ration formulated to + 3% N-Sources), Each of the N-sources was isonitrogenous (equivalent 18 mg urea). Rumen fluid was obtained from two fistulated dairy cows fed twice daily with a diet containing forage (60%) and concentrate (40%). Equal volumes of ruminal fluid from each cow collected 2 h before the morning feeding squeized through four layers and mixed with McDougall (1948) buffer pre warmed to 39° C. The inoculums was dispensed (20 mL) per syringe into 100 mL serum syringe (containing of 200 mg sample per vial) which had been warmed to 39° C and flushed with oxygen free CO2. The syringes were sealed immediately after loading and were gently mixed and then mixed three times every 3h. Syringes for each time point, as well as blanks (containing no substrate), were prepared in triplicate. Triplicate syringes were removed after 2, 4, 6, 8, 10, 12, 16, 24, 36, 48, 72 and 96 h of incubation. The gas production was recorded at 2, 4, 6, 8, 12, 18, 24, 48, 72 and 96 h of incubation.
Cumulative gas production data were fitted to the model of Orskov and McDonald (1979). P=a+b(1-e−ct) that a=The gas production from the immediately soluble fraction (mL), b=The gas production from the insoluble fraction (mL), c=The gas production rate constant for the insoluble fraction (b), t=The incubation time (h) and P=The gas production at the time t.
Laboratory Analyses
CP analyzed with the Kjeldahl N methods (AOAC, 2005) at the Ferdowsi University of Mashhad and for ADF, NDF, and ash (AOAC, 2005).
Calculations and Statistical Analysis
Data were analyzed as a completely randomized design using a general linear model (GLM) procedure of SAS, with Duncan’s multiple range test used for the comparison of means.
Result and Discussion
According to figure 1, proportion of primary nitrogen to secondary nitrogen in the PSCU after 360 minutes of exposure to liquid was %48.26 ,compared to %72.19 for optigen. The residual nitrogen at all times except 10 minutes had the significant difference, and PSCU degradation Rate was higher. Result of NH3-N release of Optigen and PSCU in sex liquid phase showed in figure 2.
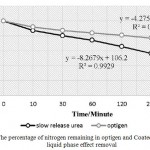 |
Figure 1: The percentage of nitrogen remaining in optigen and Coated urea following liquid phase effect removal |
Based on Figure 2, the NH3-N release of Optigen and PSCU in all liquid phases except buffered rumen fluid Freicell was significantly different (P<005). The difference in the residual nitrogen under the effect of different liquid phases showed Optigen had greater NH3-N release in acidic conditions, while PSCU in the acidic condition and effect of rumen microorganisms increased react and release. In both experiments have not brought up the results of urea culture as a source of urea was quick degradable (100% solution) and as soon as enter in any liquid phase, immediately dissolved (in less than 2 minutes).
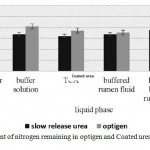 |
Figure 2: Amount of nitrogen remaining in optigen and Coated urea following removing time effect |
DiLorenzo and DiCostanzo (2007) evaluate the kinetics of NH3-N release in bath culture. they showed at 6 h, deamination from SBM protein begins to be significant, as NH3-N accumulates relative to the Blank (p=0.02). from 8 to 24 h, Urea led to greatest (P<005) NH3-N release, and greater (P<001) NH3-N release when compared to that elicited by NTS (Balchem Encapsulates, New Hampton, NY) at all times. From 4 to 24 h, biuret had the lowest (P<005) NH3-N concentrations of all NPN source, this could be do to a reduced biruetase activity in the rumen since the rumen fluid source steer was not adapted to biuret. Nitrogen utilization by rumen microorganisms can be reflected by ruminal ammonia-N concentration (Hungate, 1966). Prokop and Klopfenstein (1977), found that slow-release urea (combination of urea and formaldehyde) could decrease ruminal ammonia-N concentration by 25.3% compared to urea. A similar result was found in the report of Galo (2003), in which urea release from a polymer-coated urea was 83% as extensive as uncoated urea after 1 h incubation with distilled water. Cass and Richardson (1994) made a comparison in an in vitro study and observed that a urea-calcium combination produced slower ammonia nitrogen release rate than regular urea. Ammonia-N concentrations began to increase at 8 h for the FGU diet, which indicates that bacterial autolysis may occur. Based on this results, urea is often degraded rapidly in the rumen by the action of urease and the resulting ammonia supply may exceed the capacity of rumen bacteria to assimilate it into amino acids (Huber and Kung, 1981). This rapid release of ammonia may result in inefficient N utilization in the rumen. Therefore slow-release urea improve ammonia assimilation in the rumen.
Table 1: Diet composition and chemical analysis of different dietary treatments (% DM)
| Treatment1 | ||||
| Item | Control | Urea | Optigen | Coated urea |
| Diet composition (% DM) | ||||
| Alfalfa | 40 | 40 | 40 | 40 |
| Wheat straw | 5 | 5 | 5 | 5 |
| Corn | 27.5 | 27.5 | 27.5 | 27.5 |
| Canola meal | 17.5 | 11 | 10.95 | 10.8 |
| Wheat grain | 8 | 14 | 14 | 14 |
| Calcium carbonate | 0.6 | 0.6 | 0.6 | 0.6 |
| Salt | 0.5 | 0.5 | 0.5 | 0.5 |
| Urea | 0 | 0.5 | 0 | 0 |
| Coated urea | 0 | 0 | 0 | 0.7 |
| Optigen | 0 | 0 | 0.55 | 0 |
| Min-Vit Mix2 | 0.9 | 0.9 | 0.9 | 0.9 |
| Chemical analysis (% DM) | ||||
| Dry matter | 90.4 | 90.32 | 90.31 | |
| Organic matter | 80.2 | 80.46 | 80.43 | |
| Crude protein | 15.54 | 15.2 | 15.05 | |
| Neutral detergent fibre | 37 | 39.9 | 39.88 | |
| Acid detergent fibre | 21.4 | 21 | 21 | |
| Ash | 10.2 | 9.86 | 9.88 | |
1Treatments consist: 1) control (canola meal)., 2) urea (0.5% urea)., 3) optigen (0.55% optigen)., 4) Coated urea (0.7% Coated urea)
2Each kg contained: Vit A, 500000IU; Vit D3, 100000 IU; Vit E, 100mg; Ca, 190000mg; P, 90000mg; Na, 50000mg; Mg, 19000mg; Fe, 3000mg; Cu, 300mg; Mn, 2000mg; Zn, 3000mg; Co, 100mg; I 100mg; Se, 1mg; Antioxidant (B.H.T) 3000mg.
Table 2: Gas production in dietary samples containing different nitrogen sources1
| Treatment | |||||||
| Item | Sample | Controll | Urea | Optigen | Coated urea | SEM | P-value |
| Gas production (96 h) [ml/0.5 g DM substrate] | Straw | 69.04b | 69.43b | 72.63b | 76.62a | 1.41 | <0.0056 |
| Gas production (96 h) [ml/0.5 g DM substrate] | Barely flour | 72.04 | 72.84 | 74.27 | 75.41 | 2.67 | NS2 |
| Gas production (96 h) [ml/0.5 g DM substrate] | Barley flour + molasses | 74.17b | 80.48a | 75.97b | 76.93b | 0.86 | <0.02 |
| Gas production (96 h) [ml/0.5 g DM substrate] | Ration formulated to dairy cow | 91.81 | 91.04 | 90.82 | 91.19 | 1.39 | NS |
| Smalle chaine fatty acids (mmol) | Straw | 0.271b | 0.27b | 0.28b | 0.30a | 0.006 | <0.0056 |
| Smalle chaine fatty acids (mmol) | Barely flour | 0.28 | 0.28 | 0.29 | 0.29 | 0.01 | NS |
| Smalle chaine fatty acids (mmol) | Barley flour + molasses | 0.29b | 0.31a | 0.29b | 0.30b | 0.001 | <0.02 |
| Smalle chaine fatty acids (mmol) | Ration formulated to dairy cow | 0.36 | 0.36 | 0.36 | 0.36 | 0.006 | NS |
| Metabolizable energy (MJ/kg) | Straw | 12.00c | 12.13cb | 12.63b | 13.26a | 0.22 | <0.0045 |
| Metabolizable energy (MJ/kg) | Barely flour | 12.49 | 12.69 | 12.91 | 13.09 | 0.42 | NS |
| Metabolizable energy (MJ/kg) | Barley flour + molasses | 12.83b | 13.91a | 13.10b | 13.46b | 0.05 | <0.02 |
| Metabolizable energy (MJ/kg) | Ration formulated to dairy cow | 15.68 | 15.64 | 15.52 | 15.58 | 0.22 | NS |
| Organic matter digestibility (%) | Straw | 77.85c | 78.75cb | 81.93b | 85.88a | 1.40 | <0.0043 |
| Organic matter digestibility (%) | Barely flour | 81.18 | 82.50 | 83.92 | 85.04 | 2.65 | NS |
| Organic matter digestibility (%) | Barley flour + molasses | 83.28b | 90.11a | 84.98b | 87.26b | 0.34 | <0.02 |
| Organic matter digestibility (%) | Ration formulated to dairy cow | 101.09 | 100.79 | 100.08 | 100.45 | 1.38 | NS |
| Organic matter digestibility in DM (%) | Straw | 71.93c | 73.00cb | 75.94b | 79.61a | 1.29 | <0.0037 |
| Organic matter digestibility in DM (%) | Barely flour | 78.83 | 80.19 | 81.57 | 82.66 | 2.57 | NS |
| Organic matter digestibility in DM (%) | Barley flour + molasses | 80.20b | 84.44a | 79.63b | 81.76b | 0.32 | <0.02 |
| Organic matter digestibility in DM (%) | Ration formulated to dairy cow | 90.78 | 90.86 | 90.22 | 90.55 | 1.24 | NS |
1Means within same row with different superscripts differ(P<0.05).
2NS: not significant
Gas Production
Results showed the cumulative gas production (96 hours) influenced by diets and N-source treatments was different, which was higher gas production in formulated TMR diets for dairy cow and least gas production in wheat straw. The result indicated that Optigen (90.82) and then PSCU (90.81) the highest gas producer in the formulated TMR diets for dairy cow and the canola meal (69.04) and urea (69.43) had the least gas production in wheat straw (P<005) (table 2). Since the in vitro gas production technique has been used as a measurement of ruminal degradation of feed (Menke and Steingass 1988; Poungchompu et al. 2009) or hay (Karabulut et al. 2007), high gas production indicated high digestibility of substrates. In the current study, it was found that slow-release urea treatments had higher gas production. That was agree to other researches.
Conclusions
In this trial Optigen and PSCU were used as slow release urea. Rate of NH3-N release in Optigen as shown in figure 1,was %72.19 after 6 hours in bath culture It can be concluded, according to time that each ingredient remain in gastrointestinal tract, a large part of Optigen without being used, be excreted. PSCU had faster release rate and after 6 hours, NH3-N remaining was 48.26 percent. As a result, degradation rate should be considered as indicators to identify the sources of slow release urea.
In conclusion, final goal in dairy farms is maintained milk production and animal health. These experiments demonstrate that SRU can be utilized as an N supplement to modulate the appearance of N in the rumen and can provide equal performance to urea supplements without the potential hazards associated with feed-grade urea, and decrease feed cost and milk production price.
Acknowledgments
We gratefully acknowledge the authorities of the branch of Animal Sciences at the Ferdowsi University of Mashhad for their cooperation. This work was conducted as a Ph.D. thesis in Animal Sciences at Ferdowsi University of Mashhad (Iran). The authors gratefully thanks to Ferdowsi University of Mashhad for their endorsement, and they also especially like to appreciate Prof. A. Naserian for their comments.
Refrences
- AOAC. Official methods of analysis of AOAC International. 18 ed. Association of official analytical chemists, Arlington. VA. 2005.
- Bourg B. M, Tedeschi L. O, Wickersham T. A and Tricarico J. M. Effects of a slow-release urea product on performance, carcass characteristics, and nitrogenbalance of steers fed steam-flaked corn. Journal of Animal Science. 2012.
CrossRef - Broderick G. A, Stevenson M. J and Patton R. A. Effect of dietary protein concentration and degradability on response to rumen-protected methionine in lactating dairy cows1. Journal of dairy sci. 2009;92:2719-2728.
CrossRef - Calsamiglia S, Ferret A, Reynolds C.K, Kristensen N.B, Van Vuuren A.M. Strategies for optimizing nitrogen use by ruminants. J. Anim. sci. 2010;4:1184–1196.
- Cameron M. R, Klusmeyer T. H, Lynch G. L, Clark J. H and Nelson D. R. Effects of urea and starch on rumen fermentation, nutrient passage to the duodenum, and performance of cows. J. Dairy Sci. 74:1321. Asian-Aust. J. Anim. Sci. 1991;23:491-500.
- Casper D. P and Schingoethe D. J. Evaluation of urea and dried whey in diets of cows during early lactation. J. Dairy Sci. 1986;69:1346-1354.
CrossRef - Cass J. L and Richardson C. R. In vitro ammonia release from urea/calcium compounds as compared to urea and cottonseed meal. Texas Tech. Univ. Agr. Sci. Natl. Res. Tech. 1994.
- Chen X. B, Gomes M and Unit R. R. I. I. R. Estimation of microbial protein supply to sheep and cattle based on urinary excretion of purine derivatives-an overview of the technical details. International Feed Resources Unit. 1995.
- Cherdthong A, Wanapat M, Wachirapakorn C. Effects of urea-calcium mixture in concentrate containing high cassava chip on feed intake, rumen fermentation and performance of lactating dairy cows fed on rice straw. Livest Sci. 2011a;136:76–84.
CrossRef - Deyoe C. et al. An improved urea product for ruminants. J. Anim. Sci. 1968;27:1163.
- Fonnesbeck P. V, Kearl L. C and Harris L. E. Feed Grade Biuret as a Protein Replacement for Ruminants. A Review. J. Anim. Sci. 1975;40:1150-1184.
CrossRef - Frank B, Persson M and Gustafsson G. Feeding dairy cows for decreased ammonia emission. J. Liv. Pro. Sci. 2002;76:171-179.
CrossRef - Galo E, Emanuele S.M, Sniffen C.J, White J.H, Knapp J.R. Effects of a polymer-coated urea product on nitrogen metabolism in lactating Holstein dairy cattle. J. Dairy Sci. 2003;86:2154–2162.
CrossRef - Golombeski G.L, Kalscheur K.F, Hippen A.R, Schingoethe D.J. Slow-release urea and highly fermentable sugars in diets fed to lactating dairy cows. J. Dairy. Sci. 2006;89:4395–4403.
CrossRef - Griswold K. E, Apgar G. A, Bouton J and Firkins J. L. Effects of urea infusion and ruminal degradable protein concentration on microbial growth, digestibility, and fermentation in continuous culture. J. Anim. Sci. 2003; 81:329-336.
CrossRef - Highstreet A, RobinsonP. H, Robison J. and Garrett J.G. Response of Holstein cows to replacing urea with with a slowly rumen released urea in a diet high in soluble crude protein. Livestock Sci. 2010;129:179-185.
CrossRef - Huber J. T and Kung L, Jr. Protein and nonprotein nitrogen utilization in dairy cattle. J. Dairy Sci. 1981;64:1170-1195.
CrossRef - Hungate R. E. The rumen and its microbes. Academic Press. 1966.
- Huntington G, Harmon D, Kristensen N. B, Hanson K and Spears J. Effects of a slow-release urea source on absorption of ammonia and endogenous production of urea by cattle. Anim. Feed Sci. & Technology. 2006a; 130:225-241.
CrossRef - Johnson R. R. Influence of Carbohydrate Solubility on Non-protein Nitrogen Utilization in the Ruminant. J. Anim. Sci. 1976;43:184-191.
CrossRef - Karabulut A, Canbolat O, Kalkan H, Gurbuzol F, Sucu E, Filya I. Comparison of in vitro gas production, metabolizable energy, organic matter digestibility and microbial protein production of some legume hays. Asian Aust .J. Anim Sci. 2007;20:517–522.
CrossRef - Köster H. H. et al. Effect of increasing degradable intake protein on intake and digestion of low-quality, tallgrass-prairie forage by beef cows. J. Anim. Sci. 1996;74:2473-2481.
CrossRef
Külling D. et al. Emissions of ammonia, nitrous oxide and methane from different types of dairy manure during storage as affected by dietary protein content. J. Agricultural Sci. 2001;137:235-250.
CrossRef - Lapierre H and Lobley G. Nitrogen Recycling in the Ruminant: A Review. J. dairy sci. E2001;84:E223-E236.
- Loosli J. K, Williams H. H, ThomasW. E, Ferris F. H and Maynard L. A. Synthesis of Amino Acids in the Rumen. J. dairy Sci. 1949;110:144-145.
- McDougall E. J. Studies on ruminant saliva. 1. The composition and output of sheep’s saliva. Biochem. J. 1948;43:99.
CrossRef - McPherson W and Witt H. Feed and livestock transport cost relationships. Transportation. J. 1968;8:25-36.
- Menke K.H, Steingass H. Estimation of the energetic feed value obtained from chemical analysis and gas production using rumen fluid. Anim Res Dev. 1988;28:7–55.
- DiLorenzo N. and DiCostanzo A. In vitro release of ammonia nitrogen from various nitrogen sources in batch culture. J. Dairy Sci. 2007;90(1):100.
- Ørskov E.R, McDonald I. The estimation of protein degradability in the rumen from incubation measurements weighted according to rate of passage. J. Agric Sci.1979;92:499–503.
CrossRef - Owens F. N, Lusby K. S, Mizwicki K and Forero O. Slow Ammonia Release from Urea: Rumen and Metabolism Studies. J. Anim Sci. 1980;50:527-531.
CrossRef - Pfeffer E, Speckter H, Bornemann S, Holthausen A, Rodehutscord M. Kinetics of endogenous urea in lactating goats and cows fed diets varying in their crude protein concentrations. Arch Anim Nutr. 2009;63:230–242.
CrossRef - Pinos-Rodríguez J.M, Peña L.Y, González-Muñoz S.S, Bárcena R, Salem A. Effects of a slow-release coated urea product on growth performance and ruminal fermentation in beef steers. Italian. J. Anim Sci. 2010;9:16–19.
CrossRef - Poungchompu O, Wanapat M, Wachirapakorn C, Wanapat S, Cherdthong A. Manipulation of ruminal fermentation and methane production by dietary saponins and tannins from mangosteen peel and soapberry fruit. Arch Anim Nutr. 2009;63:389–400.
CrossRef - Prokop M. J and Klopfenstein T. J. Slow ammonia release urea. Nebraska Beef Cattle Report No. EC 77-218 Nebraska. 1977.
- Ribeiroa S.S, Vasconcelosb J.T, Moraisa M.G,Ítavoa C.F, Franco G.L. Effects of ruminal infusion of a slow-release polymer-coated urea or conventional urea on apparent nutrient digestibility, in situ degradability, and rumen parameters in cattle fed low-quality hay. Anim. Feed Sci. Tech. 2011;164:53-61.
CrossRef - Rotz C. A. Management to reduce nitrogen losses in animal production. J. Anim Sci. 2004;82:E119-E137.
- Russell J.B, Muck R.E, Weimer P.J. Quantitative analysis of cellulose degradation and growth of cellulolytic bacteria in the rumen. FEMS Microbiol Ecol. 2009;67:183–197.
CrossRef - Satter L.D, Roffler R.E. Nitrogen requirement and utilization in dairy cattle. J Dairy Sci. 58:1219–1237.
- Satter, L. D., and L. L. Slyter. 1974. Effect of ammonia concentration on rumen microbial protein production in vitro. British .J. Nutr. 1975;32:199-208.
CrossRef - Taylor-Edwards C. C. et al. Influence of slow-release urea on nitrogen balance and portal-drained visceral nutrient flux in beef steers. J. Anim Sci. 2009a;87:209-221.
CrossRef - Taylor-Edwards C. C. et al. Influence of slow-release urea on nitrogen balance and portal-drained visceral nutrient flux in beef steers. J. Anim Sci. 2009b;87:209-221.
CrossRef - Taylor-Edwards C. C. et al. Effects of slow-release urea on ruminal digesta characteristics an

This work is licensed under a Creative Commons Attribution 4.0 International License.


