

Manuscript accepted on : 02 May 2018
Published online on: 07-05-2018
Sunawan1, Yogi Sugito2, Eko Widaryanto2 and Titik Islami2
1Department of Agronomy, University of Brawijaya, University of Islam Malang, Indonesia.
2Department of Agronomy, University of Brawijaya, Malang, Indonesia.
Corresponding Author E-mail: laurensiusl@yahoo.co.id
DOI : http://dx.doi.org/10.13005/bbra/2649

ABSTRACT: Glutinous rice (Oryza sativa glutinous L.) is one of the most important types of rice for food and health industries. However, the productivity is still low because the cultivation system has not been done optimally. This is also because the research on glutinous rice cultivation is still very small. The objective of this experiment is to get the N fertilizer dosage and seedlings age that can increase the growth and yield as well as the efficiency of solar energy through increased efficiency of absorbed energy use. The treatment consisted of four levels of nitrogen fertilizer dose (D1 = 45 kg ha-1, D2 = 90 kg ha-1, D3 = 135 kg ha-1 and D4 = 180 kg ha-1) and three levels of seedlings age (U1 = 14 days, U2 = 21 days and U3 = 28 days). This treatment combination was arranged in a Split Plot Design with three replications, N fertilizer dosage as the main plot and seedlings age as the subplot. The results showed that the N fertilizer dosage used in this experiment had a significant effect on dry weight, the number of tillers, yields, absorbed use efficiency (AUE) and Energy Conversion Efficiency (ECE). Seedlings age did not give a significant effect on the number of productive tillers and grain yields. The highest grain yield was achieved by treatment of N 180 kg ha-1 fertilizer dose of 9.86 t ha-1 with AUE value of 2.83% and ECE 4.84%.
KEYWORDS: Efficiency of Solar Energy Usage and Energy Conversion Glutinous Rice; Nitrogen Fertilizer; Seedlings Age; Solar Energy;
Download this article as:| Copy the following to cite this article: Sunawan S, Sugito Y, Widaryanto E, Islami T. Effect of Nitrogen Fertilizer Dosage and Seedlings Age on the Yield and Use of Solar Energy in Glutinous Rice (Oryza sativa glutinous L.). Biosci Biotech Res Asia 2018;15(2). |
| Copy the following to cite this URL: Sunawan S, Sugito Y, Widaryanto E, Islami T. Effect of Nitrogen Fertilizer Dosage and Seedlings Age on the Yield and Use of Solar Energy in Glutinous Rice (Oryza sativa glutinous L.). Biosci Biotech Res Asia 2018;15(2). Available from: https://www.biotech-asia.org/?p=29798 |
Introduction
The glutinous rice (Oryza sativa glutinous L.) is one of the most popular varieties in Thailand (Kang et al., 2010). Glutinous rice also called waxy or sweet rice, is characterized mainly by the lack of amylose in starch (Bean et al., 1984). In Laos glutinous rice is used as a staple food (Roder et al., 1996). In Indonesia, glutinous rice is one of the essential ingredients for the food industry (Pawiroharsono, 2007). However, the glutinous rice productivity in Indonesia is still low around 42,000 tons per year (Lukman, et al., 2013) with an average yield of about 2-6 tons per ha depending on the variety. Some of the causes of the low yield of glutinous rice crops are the use of traditional technologies that are not recommended (Lukman et al., 2013, Pawiroharsono, 2007).
Nitrogen is the most important element needed for growth and development of plants (Sannagoudra et al., 2012). Variations in the availability of nitrogen can affect the development of crops and seed yields. Nitrogen fertilization affects the production of dry matter by affecting the development of leaf area, and the efficiency of photosynthesis (Kaur et al., 2012, Wang et al., 2012). Nitrogen is needed by plants in relatively larger quantities than other elements. Many previous studies have shown that N deficit is one of the major factors affecting growth and yield of plants (Zhao et al., 2000). Nitrogen deficiency generally results in stunted leaf growth caused by low assimilate formation leading to early flowering and shortening the growth cycle (Larimi et al., 2014). Nitrogen nutrition management is an important strategy in regulating rice growth and the efficiency of photosynthesis (Long et al., 2013).
The use of young seedlings and planting one stem per hill in addition to saving the use of seedlings can also increase the development potential of the tillers, the older of seedlings age in the move to the field, the less time available for the growth of tillers (Muyassir, 2012). Rice crops with the treatment of 14 days old seedlings age were able to increase paddy field production and did not differ significantly with 7 days seedlings age treatment. This can be seen from the number of tillers, leaf area, leaf area index, total dry weight of plant, growth rate, number of panicles per hill, rice production of ha-1, grain weight per hill and harvest index better than age 21 and 28 days ((Anggraini et al., 2013)). The results of Porong, (2012), showed that the age of 15 days seedlings age is the right to move cropping. There is a marked influence on LAI and grain weight of 1000 grains of rice after harvest. The total chlorophyll content of the different stages of growth increased significantly for the 10-day planting seedlings age. This can be attributed to the resulting productive roots growth and no damage to the root system during uprooting and planting. The 30-day-old seedlings age give the lowest values for total chlorophyll content (Pramanik and Bera, 2013).
Materials and Methods
Field experiments were conducted from October 2016 to February 2017 in Kepuharjo village, Karangploso, Malang, East Java, Indonesia. Kepuharjo has located 500 m asl; 7.9o South Latitude and 112.6o East Longitude. This experiments using Split Plot with treatment consists of two factors: four dosage of nitrogen fertilizer (D1 = 45 kg ha-1, D2 = 90 kg ha-1, D3 = 135 kg ha-1 and D4 = 180 kg ha-1) and three levels of seedlings (U1 = 14 days, U2 = 21 days and U3 = 28 days). The dosage of N fertilizer as the main plot and seedlings age as the subplot, each treatment was repeated three times. Land preparation is done by hand tractor twice until the soil is in the form of mud. Then made experimental plot size of 3.0 x 2.0 m by 36 plots. Seedlings were planted according to treatment (aged 14 days, 21 days and 28 days) with the plant spacing of 0.20 X 0.20 m. At 7 days after planting (DAP), the plant was fertilized with 75 kg of P2 O5 (in the form of SP-36) and 50 kg K2 O (in KCl form) per ha. Nitrogen fertilizers, in the form of Urea according to treatment (45, 90, 135 and 180 kg ha-1), were applied 3 times, at 10, 20 and 30 DAP, respectively at 20, 50 and 30%. Weeding done manually at 7, 14, and 21 DAP. Pest control is done according to the condition of pest attack. Destructive sampling was performed on 35, 49, 63 and 77 DAP. Leaf area measurements were performed on slightly older leaves (4 leaves per plant). Chlorophyll was measured by measuring leaf chlorophyll content using Konica Minolta SPAD-502 Plus and Spectrofotometer (Junior et al., 2015), an average value recorded according to treatment. Observation of the intensity of solar radiation above and below the canopy was observed by using the lux meter Lutron LX-107. Observation of the intensity of solar radiation is done by direct measurement at age 35 – 77 DAP. Daily solar intensity data obtained from Meteorology and Geophysics Climatology Station, Karangploso Malang, Indonesia. The Absorbed Use Efficiency (AUE) and Energy Conversion Efficiency (ECE) are calculated by equations (Sinclair and Mucow, 1999):
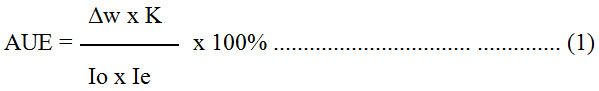
AUE: Absorbed Use Efficiency
Δw: difference of dry weight of plant g.m-2 for a certain period (t),
K: heat combustion coefficient (4.000 g.g-1)
Io: The intensity of the sun falls over the canopy cal m-2. day-1)
Ie: interception efficiency (%)
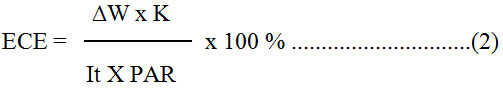
ECE: Solar Energy Conversion Efficiency (%)
Δw: dry plant weight loss (g) per m2 at a time period (t)
K: heat combustion coefficient (4,000 cal g-1)
I: the intensity of daily solar radiation (cal m-2 days-1)
t: one time period
PAR: photosynthetic active radiation (0.45)
Analysis of variance (ANOVA) was performed to analyze data using the Genstat Device. If there is a significant difference, tested using a DMRT with a 5% probability level to see the difference.
Results and Discussion
Dry Weight
Plant growth can be described by plant biomass (Zaini et al., 2017). The results showed that there was no interaction between the treatment of N fertilizer dosage and seedlings age to the total dry weight variables of the plant. However, the treatment of N fertilizer dosage had the significant effect on all ages of observation. Treatment of N 180 kg ha-1 fertilizer dose tended to give the total dry weight of plant higher than other treatment although not significantly different with N 135 kg ha-1 fertilizer treatment (Table 1). While of the seedlings age did not significantly affect the total dry weight of the plant.
Table 1: Average Dry Weeds of Plants on Treatment of N Fertilizer Dosage and Age of Seedlings
| N fertilizer (kg ha-1) | Plant Dry Weight (g clump-1) at age (DAP) | |||||||||
| 35 | 49 | 63 | 77 | 117 (harvest) | ||||||
| 45 | 3.09 | a | 11.97 | a | 22.95 | a | 38.32 | a | 79.68 | a |
| 90 | 3.14 | a | 13.24 | ab | 25.14 | a | 48.37 | b | 88.99 | ab |
| 135 | 3.39 | a | 14.14 | bc | 31.56 | b | 61.52 | c | 97.90 | b |
| 180 | 4.27 | b | 15.43 | c | 38.55 | c | 68.47 | d | 97.77 | b |
| Seedlings Age (day) | ||||||||||
| 14 | 3.28 | ns | 13.45 | ns | 30.20 | ns | 54.39 | ns | 90.08 | ns |
| 21 | 3.41 | ns | 13.68 | ns | 28.21 | ns | 55.65 | ns | 93.26 | ns |
| 28 | 3.72 | ns | 13.95 | ns | 30.23 | ns | 52.48 | ns | 89.92 | ns |
Note: Figures accompanied by the same letter in the same column show no significant difference in Duncan Test 0.05. DAP = day after planting, ns = not significantly different.
Number of Tilles and Productive Tillers
The results showed that there was no interaction between the treatment of N fertilizer dosage and of the seedlings age on the number of tillers and productive tillers per hill. However, the treatment of N fertilizer dosage had the significant effect on all ages of observation. While of the seedlings age only affects the age of 49 DAP. Increased of N fertilizer dose followed by increasing number of tillers and productive tillers. Treatment of N 180 kg ha-1 fertilizer dosage gave the higher number of tillers and productive tillers than the other treatment but not significantly different with N 135 kg ha-1 fertilizer. At the age of 49 DAP, the treatment of 14 days old seedlings gave the higher number of tillers, but not significantly different from the 21-day treatment (Table 2).
Table 2: Mean Average Number of Tillers and Productive Tillers on the Treatment of N Fertilizer Dosage and Seedlings Age
| N fertilizer (kg ha-1) | The Tillers (stem-clumps-1) at age (DAP) | The Productive Tillers (stem-clump-1) | ||||||||
| 35 | 49 | 63 | 77 | 117 (harvest) | ||||||
| 45 | 8.67 | a | 12.85 | a | 12.26 | a | 10.07 | a | 10.00 | a |
| 90 | 10.59 | b | 13.59 | ab | 14.22 | b | 12.56 | b | 11.09 | ab |
| 135 | 12.35 | c | 16.07 | bc | 16.67 | c | 15.74 | c | 12.78 | bc |
| 180 | 13.39 | c | 16.30 | c | 17.52 | c | 17.74 | d | 14.28 | c |
| Seedlings Age (day) | ||||||||||
| 14 | 11.32 | ns | 15.97 | b | 14.61 | ns | 14.44 | ns | 12.21 | ns |
| 21 | 10.87 | ns | 14.42 | ab | 15.03 | ns | 14.50 | ns | 11.56 | ns |
| 28 | 11.56 | ns | 13.72 | a | 15.86 | ns | 13.14 | ns | 12.35 | ns |
Note: Figures accompanied by the same letter in the same column show no significant difference in Duncan Test 0.05. DAP = day after planting, ns = not significantly different
Leaf Chlorophyll Contents
According to Table 3, the chlorophyll a, b and total chlorophyll content are influenced by the dosage of N fertilizer, where at age 63 DAP the dosage of N fertilizer from 45 to 180 kg ha-1 is followed by an increase in leaf chlorophyll content. The content of chlorophyll a and the total high value achieved by the treatment of the dosage of N 135 kg ha-1 fertilizer but not significantly different with the treatment of 180 kg ha-1. As for chlorophyll b achieved by the treatment of 180 kg ha-1. Seedlings age treatment did not give significant effect to leaf chlorophyll content.
Table 3: Mean value of Chlorophyll a, b and total content on Treatment of N Fertilizer Dosage and Seedlings Age
| N fertilizer (kg ha-1) | The Chlorophyll content (mg g-1) at 63 DAP | |||||
| Chl a | Chl b | Chl t | ||||
| 45 | 12.54 | a | 9.01 | a | 21.55 | a |
| 90 | 14.63 | b | 11.24 | b | 25.86 | b |
| 135 | 17.18 | c | 14.03 | c | 31.22 | c |
| 180 | 15.9 | bc | 14.37 | c | 30.26 | c |
| Seedlings Age (day) | ||||||
| 14 | 14.91 | ns | 12.02 | ns | 26.93 | ns |
| 21 | 14.92 | ns | 12.14 | ns | 27.06 | ns |
| 28 | 15.35 | ns | 12.32 | ns | 27.67 | ns |
Note: Figures accompanied by the same letter in the same column show no significant difference in Duncan Test 0.05. DAP = day after planting, ns = not significantly different
Plant Results
The experimental results showed that there was no interaction between the treatment of N fertilizer dosage and seedlings age to production and yield components. However, the treatment of N fertilizer dosages significantly affected the number of grains per clump, the weight of grain per hill, the percentage of empty grain, the weight of 1000 grains and the weight of grain per hectare. While the treatment of seedlings age has no significant effect. Increased levels of N fertilizer dosage increased the number of grains per clump, the weight of grain per hill and the weight of grain per hectare. In contrast, increased levels of N fertilizer decreased the percentage of empty grain.
The average number of grains per hill, the weight of grain per hectare and the weight of grain per hectare was achieved by the treatment of N 180 kg ha-1 fertilizer dosage of 1766 grains, 49.27 g of clump-1 and 9.86 t ha-1, respectively significantly different from the treatment of 135 kg ha-1. While the increase of N fertilizer dosage did not give a significant effect on grain weight of 1000 grains of Table 4.
Table 4: Average Number of Grain, Grain Weight, Percentage of Grain Empty, 1000 Grains Weight on Treatment of N Fertilizer Dosage and Seedlings Age.
| N fertilizer (kg ha-1) | The Number Grains (gain clump-1) | The Grains Weight (g clump-1) | Percentage Grains Empty (%) | 1000 Grains Weight (g) | The Gains Weight (t ha-1) | |||||
| 45 | 1225 | a | 38.34 | a | 20.83 | b | 26.36 | ns | 7.67 | a |
| 90 | 1390 | ab | 41.64 | a | 19.85 | b | 26.11 | ns | 8.33 | a |
| 135 | 1616 | bc | 43.86 | ab | 12.42 | a | 25.26 | ns | 8.77 | ab |
| 180 | 1766 | c | 49.27 | b | 10.50 | a | 26.69 | ns | 9.85 | b |
| Seedlings Age (day) | ||||||||||
| 14 | 1,570 | ns | 45.48 | ns | 15.15 | ns | 45.48 | ns | 9.10 | ns |
| 21 | 1,464 | ns | 42.37 | ns | 17.12 | ns | 42.37 | ns | 8.47 | ns |
| 28 | 1,465 | ns | 41.98 | ns | 15.43 | ns | 41.98 | ns | 8.40 | ns |
Note: Figures accompanied by the same letter in the same column show no significant difference in Duncan Test 0.05. ns = not significantly different
Value of Absorbed Use Efficiency (AUE) and Solar Energy Conversion Efficiency (ECE)
There was no interaction between the treatment of N fertilizer and the seedlings age against AUE and ECE. The treatment of N fertilizer dosage was significant, while the seedlings age was not significant. Table 5 shows that increased of N fertilizer dosage increase AUE and ECE values. The highest AUE and ECE values were achieved by the treatment of N 180 Kg ha-1 fertilizer dose respectively of 2.83 and 4.84%.
Table 5: Average of Absorbed Use Efficiency (AUE) and Energy Conversion Efficiency (ECE) on Treatment of N Fertilizer Dosage and Seedling Age
| N fertilizer (kg ha-1) | AUE (%) | ECE (%) | ||
| 77 DAP | 117 DAP (harvest) | |||
| 45 | 1.71 | a | 3.77 | a |
| 90 | 2.08 | ab | 4.21 | b |
| 135 | 2.65 | bc | 4.55 | c |
| 180 | 2.83 | c | 4.84 | d |
| Seedlings Age (day) | ||||
| 14 | 2.26 | ns | 4.22 | ns |
| 21 | 2.57 | ns | 4.37 | ns |
| 28 | 2.13 | ns | 4.44 | ns |
Note: Figures accompanied by the same letter in the same column show no significant difference in Duncan Test 0.05. ns = not significantly different
Discussion
The results of the experiment showed that the treatment of N fertilizer dosage significantly affected the dry weight, the number of tillers, chlorophyll content, yield, efficiency of absorbed energy use and energy conversion efficiency. The addition of the N fertilizer dosage significantly increased the dry weight, the number of tillers and the chlorophyll content (Table 1, 2 and 3).The highest values of dry weight, the number of tillers and chlorophyll content were respectively achieved in a 180 kg ha-1 fertilizer treatment. Mursal (2008), reported that nitrogen application causes an increase in the number of tiller clumps-1, the number of seeds panicle-1, the weight of seeds and the number of seeds panicle-1. The results of Susila’s research (2015) showed that the treatment of N 135 kg ha-1 fertilizer dosage resulted in higher number of tillers and dry grain yields of 3.21 tons of ha-1. This is because the addition of N fertilizer can increase the dry weight of plants (Zhang et al., 2014; Mursal, 2008). The dry weight of the plant is positively correlated with the number of tillers and total chlorophyll content and otherwise (r = 0.77 and 0.67). Increased of N fertilizer dosage followed by increased leaf chlorophyll content (Table 3). The chlorophyll content is closely related to the AUE and ECE values (Figure 1), as well as positively correlated with ECE (r = 0.69).
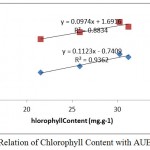 |
Figure 1: Relation of Chlorophyll Content with AUE and ECE
|
The dosage of nitrogen fertilizer significantly improved yield, AUE and ECE (Tables 4 and 5). The increase of N fertilizer dosage from 45 kg ha-1 to 180 kg ha-1 increased the dry weight of the plant, the number of grains clump-1, the grains of weight clump-1 and the grains of weight ha-1 18.50; 30.63; 22.18 and, 22.31% respectively. High grain yield was achieved in the treatment of N 180 kg ha-1 fertilizer dosage of 9, 86 t ha-1. The results of Alfiyan et al., (2014) showed that nitrogen fertilization in various forms in direct seedling produces better biomass components than nitrogen fertilization in the plant move treatment. Results and ECE have a close relationship with the values y = 1.943x + 0.213 and R2 = 0.94 (Figure 2) and have a positive correlation (r = 0.66).
The efficiency of the use of absorbed energy (AUE) and ECE is greatly influenced by the N fertilizer dosage. Increasing the N fertilizer dosage increases the AUE value (Table 5). AUE is positively correlated with dry weight and the number of tillers and otherwise (r = 0.85 and 0.52). The efficiency of radiation usage increases at the rate of application of N, With the same N fertilizer rate, different methods of N-fertilizer application affect RUE and grain yield (Li et al., 2012). The increase of N fertilizer dosage was followed by the increase of AUE and ECE values, the highest value achieved in the treatment of N 180 kg ha-1 fertilizer dosage of 2.83% and 4.84% (Table 5), respectively. As reported by Slattery and Ort (2015), that the average ECE value of rice crop (C3) is 3.99%. The value of AUE and ECE is influenced by the dry weight value of the plant.
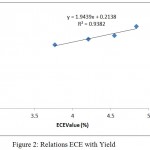 |
Figure 2: Relations ECE with Yield
|
Conclusion
Treatment of N fertilizer dosage and seedlings age did not have interaction with growth variable. The addition of N fertilizer dosage of 45 -180 kg ha-1 can increase the number of tillers, dry weight of plant, leaf chlorophyll content, yield, AUE value and ECE value. Grain yield, AUE value, and highest ECE value were achieved at fertilizer N 180 kg ha-1 dosage, each of 9.86 t ha-1, 2.83 and 4.84%. While of the seedlings age did not give a real effect, but the seedlings age of 14 days tend to give better results than the seedlings age 21 and 28 days.
Acknowledgment
The research was funded by the Directorate General of Higher Education, Ministry of Research, Technology and Higher Education of Indonesia under Ph.D. scholarship in the University of Brawijaya, contract No. 169.9/E.4.4/2013, September 9, 2013. Thanks to the students of the Faculty of the University of Islam Malang to assist in this research.
Author Contribution
SNW develops concepts, conducts experiments and organizes manuscripts. YS, EW, and TI as research reviewer and finalization of the manuscript.
Conflict of Interest
The authors state that this study is conducted without any conflict of interest.
Reference
- Alfiyan A, Noor A.S. dan Eko W. Pengaruh Umur Transplanting Benih dan Pemberian Berbagai Macam Pupuk Nitrogen Terhadap Pertumbuhan dan Hasil Tanaman Jagung Manis (Zea mays saccharata Sturt.) The Effect of Transplanting Age and Application of Various Nitrogen Fertilizers on Growth and Yield of Sweet Corn. J. Prod. Tan. 2014;2(1):1–9.
- Anggraini F, Suryanto A. dan Aini N. Sistem Tanam Dan Umur Bibit Pada Tanaman Padi Sawah (Oryza sativa L .) Varietas Inpari 13. Cropping System and Seedling Age on Paddy ( Oryza sativa L .) Inpary 13 Variety. Prod. Tan. 2013;1(2):52–60.
- Bean M.M, Esser C.A, and Nishita K.D. Some physicochemical and food application characteristics of California waxy rice varieties. Cereal Chemistry. 1984;61(6):475–480
- Kang M.Y, Rico C.W and Lee S.C. Physicochemical properties of eight popular glutinous rice varieties in Korea. Plant Produc. Sci. 2010;13(2):177–184. http://doi.org/10.1626/pps.13.177.
CrossRef - Kaur A, Bedi S, Gill G.K and Kumar M. Original Paper Open Access Effect of nitrogen fertilizers on radiation use efficiency , Crop growth and yield in some maize (Zea mays) genotypes. Maydica. 2012;57:75–82.
- Larimi S.B, M. Shakiba A.D. Mohammadinasab and M.M.V. Changes in nitrogen and chlorophyll density and leaf area of sweet basil ( Ocimum basilicum L .) affected by biofertilizer and nitrogen application. J. of Bioscie. 2014;5(9):256–265.
- Li D, Tang Q, Zhang Y, Qin J, Li H, Chen L and Peng S. Effect of Nitrogen Regimes on Grain Yield, Nitrogen Utilization, Radiation Use Efficiency, and Sheath Blight Disease Intensity in Super Hybrid Rice. of Integrat. Agric. 2012;11:134–143. http://doi.org/10.1016/S1671-2927(12)60791-3.
CrossRef - Long J.R, M.AG.H, Wan Y.Z, Song C.F, Sun J and Qin R.J. Effects of nitrogen fertilizer level on chlorophyll fluorescence characteristics in flag leaf of super hybrid rice at late growth stage. Rice Scie. 2013;20(3):220–228. http://doi.org/10.1016/S1672-6308(13)60138-9.
CrossRef - Lukman A, Anggraini D and Rahmawati N. Pembuatan dan Uji Sifat Fisikokimia Pati Beras Ketan Kampar yang Dipragelatinasi. Preparation and Test of Physicochemical Starch of Glutinous Rice Kampar in pre gelatination. Penel. Farmasi Indonesia. 2013;1(2):67-71.
- Mursal E.A.D. Effect of Nitrogen and Phosphorus Fertilizer on Growthand Yield of Rice (Oryza sativa) In White Nile State – Sudan. A Thesis Submitted to the University of Khartoum in Partial Fulfillment of the Requirement for the Degree of Master of Science (M.Sc.) in Agronomy. 2008;47.
- Efek Jarak Tanam , Umur dan Jumlah Bibit terhadap Hasil Padi Sawah (Oryza sativa L.). Effect of Planting Distance, Age and Number of Seedlings of Paddy Rice Results (Oryza sativa L.) J. Manaj. Sbr. daya Lahan. 2012;1(2):207–212.
- Pawiroharsono S. Potensi Pengembangan Industri dan Bioekonomi Berbasis Makanan Fermentasi Tradisional. Potential of Industrial Development and Food-Based Bioeconomics Traditional Fermentation. Ilmu Kefarmasian Indonesia. 2007;5(2):85–92.
- Porong V.J. Perbedaan Umur Bibit Terhadap Pertumbuhan Dan Produksi Padi Sawah (Oryza sativa). Effects of Age Differences of Seedlings on Growth and Production of Paddy Rice (Oryza sativa L). Eugenia. 2012;18(1):35–38.
- Pramanik K and Bera K. Effect of Seedling Age and Nitrogen Fertilizer on Growth, Chlorophyll Content, Yield and Economics of Hybrid Rice (Oryza sativa L.). Inter. J. of Agron. and Plant Produc. 2013;4(S):3489–3499.
- Roder W, Keoboulapha B, Vannalath K and Phouaravanh B. Glutinous rice and its importance for hill farmers in Laos. Economic Botany. 1996;50(4):401–408. http://doi.org/10.1007/BF02866522.
CrossRef - Sannagoudra H.M, G.S. Dasog P.L.P and N.G.H. Yield and nitrogen uptake by drill sown paddy as affected by different coatings of urea under two row spacings *. Karnataka J. Agric. Sci. 2012;25(4):535–536.
- Sinclair T.R and Muchow R.C. Radiation Use Efficiency. Advances in Agronomy. 1999;65:215-265.
CrossRef - Susilo J, dan Ariani E. Pengaruh Jumlah Bibit per Lubang Tanam dan Dosis Pupuk N, P dan K terhadap Pertumbuhan dan Produksi Padi Sawah (Oryza sativa) dengan Metode SRI. Effect of Number of Seedlings per Planting Hill and Dosage of N, P and K Fertilizer on Rice Growth and Production (Oryza sativa L.) with SRI Method. Jom Faperta. 2015;2(1): 1–15.
- Wang D, Maughan M.W, Sun J, Feng X, Miguez F, Lee D, and Dietze M.C. Impact of nitrogen allocation on growth and photosynthesis of Miscanthus (Miscanthus giganteus). GCB Bioenergy. 2012;4(6):688–697. http://doi.org/10.1111/j.1757-1707.2012.01167.x
CrossRef - Zaini A.H, Hariyono D and Wicaksono K.P. Performance of rice (Oryza sativa ) varieties in rainy season and interaction with plant spacing. Bioscience Research. 2017;14(3):662-667.
- Zhang J, Bei Z, Zhang Y and Linkui Cao. Growth Characteristics , Water and Nitrogen Use Efficiencies of Spinach in Different Water and Nitrogen Levels. Sains Malaysiana. 2014;43(11):1665–1671.
- Zhao D, Oosterhuis D.M and Zhao D.L. Nitrogen application effect on leaf photosynthesis, nonstructural carbohydrate concentrations and yield of field-grown cotton. Special Report Arkansas Agricultural Experiment Station. 2000;198(1):69–71.

This work is licensed under a Creative Commons Attribution 4.0 International License.


