

Manuscript accepted on : 12 December 2017
Published online on: --
O O. Sulaiman
School of Ocean Engineering, University Malaysia Terengganu.
Corresponding Author E-mail: o.sulaiman@umt.edu.my
DOI : http://dx.doi.org/10.13005/bbra/2565

ABSTRACT: Ocean and Coastal farming has potential economic benefits as a source of sustainable. Prototype plantations have been deployed in coastal areas and therefore are competing for limited space with other shoreside activities such as recreation and industry. If seaweed can be cultivated in relatively deeper waters away from populated areas, production may be expanded using larger areas not presently exploited for other purposes. Prototype systems aquaculture plantations have so far relied on ad hoc, field developed mooring systems, rather than engineering design principles. Such systems may not be sufficiently reliable for deepwater deployments, where repairs are more costly and resources are scarce. A quickest way to obtain design loadings for seaweed would be to carry out model tests on some available seaweed samples.The main difficulty is that the flow kinematics (fluid velocities/accelerations) that can be produced in the available model basin, at the Marine lab of the Universiti Teknologi Malaysia in Johor Bahru, where the tests are to be carried out, are suitable only at smaller scale. This paper describes the model tests and analysis used to develop the loads needed so that the mooring system for the aquaculture system can be designed based on methods like those used for offshore structures.
KEYWORDS: Deepwater Kinematics Prototype Aquaculture; Plantations;
Download this article as:| Copy the following to cite this article: Sulaiman O. O. Model Test for Determination of Hydrodynamic Ocean Coeficient for Design of Aquaculture Mooring System for Oceanic Macroalgae Farming. Biosci Biotech Res Asia 2017;14(4). |
| Copy the following to cite this URL: Sulaiman O. O. Model Test for Determination of Hydrodynamic Ocean Coeficient for Design of Aquaculture Mooring System for Oceanic Macroalgae Farming. Biosci Biotech Res Asia 2017;14(4). Available from: https://www.biotech-asia.org/?p=28433 |
Offshore Aquaculture for Oceanic Seaweed Marine Alage Farming
The ocean represent one big frontier for humanity to explore, much of it biological species remain untap. The case of seaweed or marine algae stands significant because of its potential to that benefit solution to human activities that end with unwanted effect. For example, the green algae (Chlamydomonas reinhardtii) seaweed is used as biomass, hydrogen fuel source, as it can produce superior amount of vegetable oil and heat compare with terrestrial crop. Marine algae are used as food supplement that provide the body with additional fuel and immune body system regulatory response. It contains extensive fatty acid profile including Omega 3 and Omega 6 and it contain abundant vitamins, mineral, and trace elements. Chondrus crispus know as carrageen is an excellent stabilizer in milk, gelatin and cosmetic product. Algae are used as fertiliser for livestock and soil; Algae are also used for waste water pollution control. Figure 1 shows seaweed under test in towing tank.
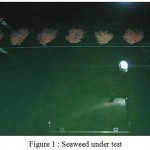 |
Figure 1: Seaweed under test
|
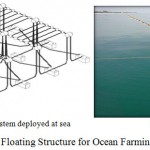 |
Figure 2: Floating Structure for Ocean Farming System
|
The study focuses to produce a design for offshore floating structure of seaweed farming. This design is required to meet the operating conditions, strength and serviceability requirements, safety requirements, durability, visually pleasing to the environment and cost-effective. An appropriate design service life is prescribed depending on the importance of the structure and the return period of natural loads. Its service life is generally expected to be as long as 50 to 100 years with preferably a low maintenance cost. The structure will be operating 200 meters from the shore as a result; the structure is likely to experience more energizes wave action and stronger wind associated with deep water region. This design also considered 1-2 boat lanes within the structure blocks which is about 5 meters wide at the original size. In the structural design of floating offshore structures, the external load and major load effect, such as cross sectional forces, are determined from the rigid body motions. The dimensions of structural members and arrangement are subsequently determined so that the structure has sufficient strength and stiffness against the given loads and loads effects. The hydrodynamic loads measured will be used to build approximate scale models of the seaweed. The model seaweed will mimic the Froude-scaled properties (mass, dimensions, added mass and damping) of the seaweed measured previously. Suitable material such as plastic ribbon, rubber tubing or even young seaweed seedlings will be used to build a sufficiently quantity of scaled seaweed.
Environmental Load Consideration
The weather in Malaysia is mainly influenced by two monsoon regimes, namely, the Southwest Monsoon from late May to September, and the Northeast Monsoon from November to March. (K.C.Low, 2006). However the east coast of peninsular Malaysia is the area that exposed directly to the strong sea currents and periodic monsoon season which is prevalent off the east coast. Furthermore, with the existence of nature elements of the deep and open water environment, seaweed farming is hard to be applied in this area. Regular waves were considered and generated by the wave maker for a few tests. Random waves spectrum was based on the Jonswap spectrum for less than 1Yr or for 1Yr or greater, respectively. Froude scaling was applied to establish the relationship between full scale wave height (Hp) and period (Tp) and the corresponding model scale wave height (Hm) and period (Tm), where Hm = Hp/50 and Tm = Tp/Ö50 (Table 1). Incident waves will be measured and analyzed prior to the tests. Two wave probes will be installed for calibrations: one in front of the carriage at the basin centreline and one to the side of the nominal position of the model. Wave force vector is generally expressed as the sum of linear wave force proportional to wave height and the slowly varying drift force proportional to the square of the wave height.
Table 1: Full Scale Wave
| Return Period (Year) | Full Scale Wave Height (m) | Full Scale Wave Period (s) |
| 90% | 4.599 | 9.711 |
| 95% | 4.850 | 10.25 |
| 1/12th | 0.6 | 1.295 |
| 1-Yr | 5.110 | 10.79 |
| 10-Yr | 10.7 | 12.82 |
| 100-Yr | 7.3-13.6 | 11.1-15.1 |
Mooring design for offshore platforms makes use of software tools which have been benchmarked against model tests, computational data and full scale measurements for their given applications. Hydrodynamic loading on the platform, risers and mooring system itself due to waves and currents are calculated using a variety of tools such as potential flow, CFD and empirical data.
Model Test
The model test is required to determine the hydrodynamic loads due to waves and currents acting on seaweed and its mooring system components. The total system loads must be suitable for use in designing a seaweed culture mooring system to avoid failure with potential loss of the valuable crop and possibly requiring costly repairs or replacement of the mooring system components. A towing test conducted at UTM marine Lab involved (Figure 3) one method of research to determine the hydrodynamic loading coefficients (added mass and damping) in a few different configurations.6 The samples which are seaweed are dried, but will restore to nearly nominal properties when soaked in water for a period of time. In typical practice, the rows of seaweed are held using ropes separated by about 2.6 m between rows and the measured forces recorded on the model basin’s data acquisition system (Figure 3).
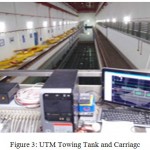 |
Figure 3: UTM Towing Tank and Carriagc
|
Component of the full-scale platform and mooring cable characteristic first need to be clarified.A typical blockhas an overall length of 100 meter and the breadth is 100 meter. One block of seaweed farming contains four main ropes for the frame, four main buoy and 30 load lines on which is the seaweed will be planted. Table 1shows the structural properties of one block of seaweed farming (Table 2 and 3).
Table 2: structural properties
| Item | Model |
| Length Overall for 10 Blocks, L | 2m |
| Breath, B | 2m |
| Dimension for Each Block | 2m x 2m |
| Mooring Depth, D | 2.5m |
The model test is desiged to investigate the modeling laws required for the system in question to be analyzed. The scaling parameters is very important in designing a model test and a few key areas of consideration in replicating a prototype structure for a physical model test. In order to achieve similitude between the model and the real structure, Froude’s law is introduce as the scaling method. Froude’s law is the most appropriate scaling law for the free and floating structure tests (Chakrabarti, 1998). The Froude number has a dimension corresponding to the ratio of u2/gD where u is the fluid velocity, g is the gravitational acceleration and D is a characteristic dimension of the structure Figure 4 shows the scale model. The subscripts p and m stand for prototype and model respectively and λ is the scale factor. Assuming a model scale of l and geometric similarity, the Froude model must satisfy the relationship:
u 2p / gDp = u 2m / gDm
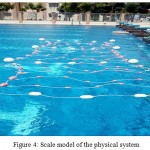 |
Figure 4: Scale model of the physical system
|
The load cells attached to the mooring spring are water-proof aluminium ring strain gauges that measure axial tensile loads. The measured voltage outputs from the load cell strain gauges are connected by cables to the basin’s native Dewetron Data Acquisition System (DAQ)) to be digitally sampled and stored. Software is used to convert the measured voltage to tension readings. The load cells are appropriately scaled and calibrated (100N range). Other instruments used in the tests are wave probes fixed at specific locations under the carriage and accelerometers mounted on the model decks. Both are channeled to the DAQ to record measured data output. A video camera was positioned at strategic locations on the carriage for model motion recordings.
Tests for Seaweed Hydrodynamic Coefficients
Tests is carried out to identify hydrodynamic coefficients of an equivalent Morison model of the seaweed which will be suitable for use in typical mooring design and analysis package such as Arienne. Samples (clumps) of dried seaweed, the dried will restore to nearly nominal properties when soaked in water for a period of time (Figure 5). Typical size seaweed clump weigh up to 1.5kg in air, when fully grown. However, the natural buoyancy of the seaweed, make its weight in water almost insignificant. A sample clump of seaweed weight in air 4.1N and the corresponding weight in water is 0.01N in UTM lab (Figure 2).
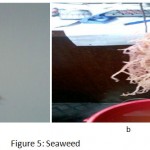 |
Figure 5: Seaweed
|
A sample row of seaweed is attached to a frame and towed from the carriage. To determine the hydrodynamic coefficient, a series of tests including towing in calm water, towing in waves and wave-only tests will be performed. As mentioned, originally, it was planned to use the PMM to perform forced oscillation tests. The resulting loads can be analysed in a straightforward manner to determine the relevant coefficients which give similar hydrodynamic loads.
The tests of floating structure in regular and irregular waves will be carried out in the towing tank 120m x 4m x 2.5m of Marine Technology Laboratory UTM. This laboratory is equipped with the hydraulic driven and computer controlled wave generator which is capable to generate regular and irregular waves over a period range of 0.5 to 2.5 seconds. For this structural experiment, a model of 2m x 2m per block with 50 scale ration will be used (Figure 6).
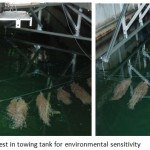 |
Figure 6: Seaweed test in towing tank for environmental sensitivity
|
Environmental Sensitivity
For this research, currents are considered because of the dominant contribution of load compared with wave and wind. In addition, it is expected that drag loads will account for a large portion of the wave-driven loads as well. So, by studying the drag loads first, we hope to quickly arrive at an approximate model that is adequate for the design of major system components. Static current loads are discussed in detail below.4 Static loads due to current are separated into longitudinal load, lateral load.5 Flow mechanisms which influence these loads include main rope drag, main buoy drag, seaweed drag, and planting lines drag. The general equation used to determine lateral and longitudinal current load are
![]()
The solution chosen at present is to focus on certain key non-dimensional values and try to use the use different scaling factors to apply the results at fullscale. In this way, the kinematics available in the towing tank can be used. For example, it is believed that the physical behaviour of seaweed may be similar to that of cylinders in waves and currents. Therefore, the approach closely follows that of the commentary section of the API RP-2A. For example, the effects on hydrodynamic loading of Keulegan-Carpenter number
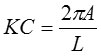
Where: A= amplitude of wave partical motion, L= typical length of a seaweed clump
Wave current flow reversal effects (r=ratio of current/wave orbital velocities) are expected to be similar to those for cylinders, though perhaps somewhat more complex and with different regimes for seaweed. Table 1 (a, b) below shows the nondimensional parameters for a series of seastates, typical of the Southeast Asia metocean climate. Note, it is not envisaged to design the seaweed mooring for extreme environments such as rare 100-year events, typically used for offshore platforms, because the consequences of potential failure, while still undesirable, are considered much less severe.
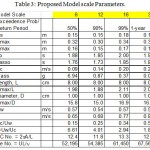 |
Table 3: Proposed Model scale Parameters.
|
As these tests are currently ongoing, results will be presented as they become available in time for the conference.
Result
The test was carried out at different low direction, to simulate how the current environment will affect the seaweed. From Figure, it is clear that tow 1 line in transverse direction produce more drag. The maximum test speed at which the system get overload is 1.2m/s, at that point, the drag for 1 line is about 1.8, while for two tow line is about 0.2. Outrigger is also observed at the beginning of the speed, and nearly steady drag is observed for both cases at speed of 0.5 to 0.8 (Figure 7).
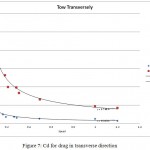 |
Figure 7 : Cd for drag in transverse direction
|
Towing at diagonal shows similar trend withy much lower drag on the first line, however it is observed that the current speed get the chance to impact internal lines that supposed to be protected by shielding effect. This revealed that the diagonal current direction can tend to impose more added mass on the system. Steady drag is observe between 0.5-1m/s (Figure 8).
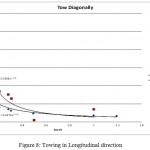 |
Figure 8: Towing in Longitudinal direction
|
Figure 9 shows that strain increases with the increasing of current speed. The graph indicates that the second planting lines have a lower value compares to the first lines. This is due to the shielding affecting which the turbulent current acting on second line resulting the lower drag.
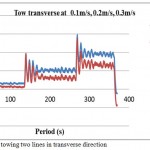 |
Figure 9: Drag for towing two lines in transverse direction
|
The Figure 10 obliviously shows that, when the current velocity was increases, the current drag force also increases. That represent the current velocity is one of the biggest factors that control the current drag force.
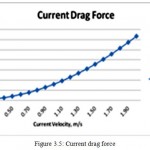 |
Figure 3.5: Current drag force
|
Conclusion
Aquaculture farming is widely being practice onshore or near shore, due to uncertainty about the force nature of nature, lack of established design methodology, rules and guideline. The case presented represents real life solution research to solve problem facing aquaculture industry offshore. Extreme current speed is considered for the test. The result obtained represent meaningful information for the design and simulation towards reliable deployment of very large floating oceanic structure for seaweed farming and other aquaculture farming.
Reference
- American Petroleum Institute Recommended Practice for Design and Analysis of Station Keeping Systems for Floating Structures, Recommended Practice 2SK, 2nd Edition.1997.
- Det Norske Veritas Offshore Standard for Position Mooring, Offshore guide. 2010.
- Buck B.H and Buchholz C.M. The offshore-ring: A new system design for the open ocean aquaculture of macroalgae. Journal of Applied Phycology. 2004;16:355-368.
CrossRef - North W.J. Oceanic farming of Macrocystis, the problems and non-problems. In Seaweed Cultivation for Renewable Resources (ed. Benson, K. T. B. a. P. H.), 19 Elsevier, Amsterdam. 87;3967.
- Chakrabarti S. (1987). Hydrodynamics of Offshore Structures. Plainfield, Illinois: WIT Press. Chakrabarti S Physical Model Testing of Floating Offshore Structures. Dynamic Positioning Coference. 1998.
- Huse E. (1996). Workshop on Model Testing of Deep Sea Offshore Structures. ITTC 1996, 21st International Towing Tank Conference Trondheim, Norway, NTNU, Norwegian University of Science and Technology. 1996;161-174.
- Moan T. (2004). “Safety of floating offshore structures” Proc. 9th PRADS Conference, Keynote lecture, PRADS Conference, Luebeck-Travemuende, Germany, September. 2004;12-17.
- Sulaiman O.O , et al (2012). Preliminary Design and Prototpe Scale Model of Offshore Aquaculture Floating Structure For Seaweed Ocean Farming. International Conference Ship and Offshore Technology, ICSOT Busan, Korea: The Royal Institution of Naval Architects. 2012; 21-34.

This work is licensed under a Creative Commons Attribution 4.0 International License.


