

Manuscript accepted on : 05 September 2017
Published online on: --
Plagiarism Check: Yes
Firoz Ahmad and Laxmi Goparaju
Vindhyan Ecology and Natural History Foundation, Mirzapur, Uttar Pradesh, India.
Corresponding Author Email: adfiroz@yahoo.com
DOI : http://dx.doi.org/10.13005/bbra/2530

ABSTRACT: The increasing population has posed a threat to the existence of the forests, which provide many services to us. Of late, they seem to be degraded, deforested and converted into other land use classes. In such situation, it becomes necessary to monitor and analyze the changes such that in future protection measures are enforced suitably. Geospatial technology, which is a combination of satellite remote sensing data, GIS and GPS offers better prospective in analyzing the changes in natural resources over various spatial scales and spectral resolutions. The present study aims to study both qualitatively and quantitatively, analyzing and predicting the changes in forest cover by generating forest cover classification map, area statistics, transition matrix in part of Saranda forest of West Singbhum district of the state of Jharkhand, India using remote sensing and GIS. The study evaluates the magnitude, rate and dynamics of change in the spatial extent of the forest between 1975 and 2015 using multi-temporal datasets (Landsat MSS 1975, ETM+ 1999 and OLI/TIRS 2015. The analysis revealed that the dense forests periodically are showing a decreasing trend which constitutes approximately 50%, 33% and 27% of the study area in 1975, 1999 and 2015 respectively. Finally using Markov chain analysis (MCA) forest cover area statistics was predicted for the year 2031. This analysis would help to have a holistic view of the future scenario of forests which would guide the policy makers and managers. Strict policy implementation to safeguard the forests against various anthropogenic pressures and community involvement is necessary to prevent further destruction of forests.
KEYWORDS: Forest cover; Geographic Information System; Markov; Remote Sensing; Saranda
Download this article as:| Copy the following to cite this article: Ahmad F, Goparaju L. Predicting Forest Cover and Density in Part of Porhat Forest Division, Jharkhand, India Using Geospatial Technology and Markov Chain. Biosci Biotech Res Asia 2017;14(3). |
| Copy the following to cite this URL: Ahmad F, Goparaju L. Predicting Forest Cover and Density in Part of Porhat Forest Division, Jharkhand, India Using Geospatial Technology and Markov Chain. Biosci Biotech Res Asia 2017;14(3). Available from: https://www.biotech-asia.org/?p=27456 |
Introduction
Forest cover loss aggravates the loss of genetic resources, biodiversity and wildlife habitat. It affects the utilization of the environmental goods and services provided by the ecosystems for the mankind, changes the biogeochemical cycles (Turner 2005) and gives way to the invasive and alien species (Cairns et al., 2000; Velázquez et al., 2002). The loss further increases the cases of flooding and encourages the degradation of soil. The world has lost a significant area of forest cover since 1990s (8.3 million hectare of forest per year). The tropical forests of the world accounted for a loss of 5.2 million hectares between the time period 2000-2010 ( Brambilla et al., 2000; FAO, 2012). The most vulnerable of all the ecosystems are the tropical forests. Many tribal and native populations depend on the forests for their livelihood. It is observed that about one-third of the world’s population depends on the forests for their sustenance more importantly in less developed countries. The dependency on wood as a fuel is still prevalent despite new alternatives (FAO, 2014).
In recent years the ever increasing population has put pressure on the forests which has resulted in the changing patterns of the land use to suffice the demands globally (Yu & Ng 2007). In the past few decades, a decline in the forest areas had sought attention because of the environmental impact observed at local, regional and global scales (Cabrera & Vilatta 2013; Chen et al. 2013; Lambin & Meyfroidt 2011). Thus, forests have reduced in size and significant changes in the patterns of the natural landscape have led to the global climate change (Leuzinger et al. 2011; Watson et al. 2000; Abdalla et al. 2013; Dale 1997). The conversion of fringes of forest into agriculture, illegal logging and indiscriminate cutting and grazing contributes to the fragmentation of the forests and degradation of the landscape (Kabba & Li 2011). The quantification of the changes over a period of time is important to comprehend the forest cover patterns and the relationship with the environmental factors necessary for the development (Pal & Mather 2004).
India is one of the biodiversity rich countries where the forests cover is about 701,673 sq km, or 21.34% of the country (ISFR, 2015). The forest productivity in Indian forests is roughly one tenth of its potential which is due to the growing biotic pressure and inadequate resources for scientific forest management (FAO Report 1997).
Geospatial technology (including remote sensing, GIS and GPS) has the potential and provides the capacity to acquire suitable satellite data, analyse large datasets in GIS and interpret the outcome about various natural resources information at various spatial scales in less time and in cost effective manner (Lillisand and Kiefer ,2000). The availability of Landsat satellite data from USGS (free download) provides images since 1972 has given many opportunities for researchers to study the changes taking place on the Earth’s surface. It has coverage worldwide with spatial resolution of 30m. Many studies have utilized the multi temporal satellite data and change detection techniques to analyse the forest dynamics (Tang et al., 2002; Coppin et al., 2004).
Satellite remote sensing images provide updated information and comprehensive views and use different parts of the electromagnetic spectrum to record characteristics of various features on ground (Antwi et al. 2014; Fonji & Taff 2014). The repetivity, speed and variety of data types are of great value to study the natural resources (Mabwoga & Thukral 2014). Thus, satellite remote sensing data becomes a major source for studies of urban areas , landscapes and natural environments (Peled & Gilichinsky 2013; Ye et al. 2011; Bhatta et al. 2010; Pelorosso et al. 2009). Further, when coupled with GIS modelling such as Markov Chain model, it provides data for monitoring the spatial development to increase the understanding of the current trends of development. A better understanding of forest cover in various proportions and changes taking place over a period of time is achieved for proper planning and development.
Remote sensing satellite images of different resolutions were extensively used to estimate accurately not only deforestation and reforestation but also degradation and regeneration at various scales (Celine et al 2013). It is a reliable data source and gives up to date information on area, change in area, growing stock, wood and non-wood products, carbon, protected areas, biological diversity and contribution of forests to the nation’s economy, which helps in formulation policies and programmes to achieve sustainable forestry (Ridder 2007). Using Markov chain analysis, future prediction scenarios have been studied in various natural resources for e.g Oludare et al. (2015) in forest reserve assessment, (Mahmood et al. 2015) in hydrological responses and (Moghadam & Helbich, 2013) in urban growth analysis. Akingbogun et al. 2012 analyzed the forest degradation and utilized Markov chain analysis for prediction and monitoring.
Further, to understand the various historical and current driving factors which bring about the change in the forest cover and landscape, many simulation models have been developed to study the changes both spatially and dynamically, which would further assist in the management strategies(Brown et al., 2004; Sturtevant et al., 2007). Various statistical approaches like logistic regression and static modeling have been applied to study the influence of environmental and spatial variable in the distribution of forest and other vegetated areas (Guisan and Zimmermann, 2000).
Oludare et al (2015) analyzed Landsat TM imageries of 1984 and 2000 and OLI/TIRS of 2014 to identify, classify, assess and interpret changes in the Gambari Forest Reserve, Nigeria for the time periods 1984, 2000 and 2014 and also predicted LULC for the year 2044 using Markov analysis. The analysis indicates that the thick forest and plantation of LULC class were fast declining and various anthropogenic activities were responsible such as illegal felling of trees for timber, fuelwood and farming. Khoi & Muriyama (2010) evaluated Landsat imageries of time periods 1993, 2000 and 2007 for Tam Dao National park Region, Vietnam and also predicted LULC for the year 2014, 2021 using Markov analysis. The primary forest class was showing a decreasing trend due to forest clearance, which indicates that intensified protection measures are required to prevent further loss of the primary forest. Giriraj et al. 2008 utilized MSS of Landsat (1973), LISS-1 of IRS-1A (1990) and LISS-3 of IRS—P6 (2004) to study Kalakad-Mundanthurai Tiger Reserve (KMTR) of South Western Ghats , Tamil Nadu, India and also predicted future scenario for the year 2010, 2020. The analysis shows that the evergreen forest is decreasing continuously whereas 27% of the non-degraded forest would be converted to the degraded category by the year 2020. Kayet & Pathak (2015) used Landsat TM imageries of 1992, 2005 and IRS LISS-III imagery of 2014 to identify Land use/Land cover Change Detection Mapping in Saranda Forest, Jharkhand, India The result manifest that the dense forest is showing the decreasing trend whereas the open forest, agricultural land and plantations are showing an increasing trend. Reddy et al., 2017 utilized multitemporal satellite data to generate forest covers of India. Futher, using Land Change Modeler, forest cover changes were simulated and prediction was done for the year 2025. It is predicted that there will be widespread deforestation in North east India and Andaman and Nicobar Islands.
The present study has been conducted in state of Jharkhand, which is known for good forest cover. Recently according to the Jharkhand Economic Survey (2015-16), it has been noted that the forest cover in the state has declined by 0.5% to 0.79% mainly in five districts namely Ranchi, Dumka, Giridih, Pakur and West Singhbhum between the time periods 2013-2015. Further, Indian forest survey report, 2015 states that very dense forests account for 3.26%, moderately dense forest 12.12% and open forests 14.08%. The percentage of open forests is more as compared to the other classes. Global forest watch (www.globalforestwatch.com ) has also reported tree loss in this area.
The forests of West Singhbhum are pristine and some of the areas have been untouched mostly the forests at high altitudes. Increasing anthropogenic pressure has put the forests under stress because of which they are degrading and at places conversion to other land uses has led to deforestation. In such scenario it is a prerequisite that good database is available at spatial and temporal domain so that future policy decisions can benefit from it.
The objective of the present work is 1) to generate forest cover map of the Porhat forest division for the years 1975, 1999 and 2015 2) To study the spatial and temporal change in forest cover classes using transition matrix. 3) Using Markov analysis to extrapolate and predict the status of forest cover for the year 2031.
Study Area
The study area, a part of Porhat forest division, lies in the West Singhbhum district of Jharkhand. The district has a total of 15 blocks and two administrative headquarters. The study area chosen for the analysis covers an area 141837 hectares lying between latitudes 22º 31′ 19”N to 22º 51′ 11”N and longitudes 85º 11′ 26”E to 85 º 33′ 56”E. (Fig: 1). It falls roughly in four blocks namely, Sonua, Bandgaon, Goelkera and Gudri. The terrain is reported to be undulating with valleys and steep mountains where the range for altitude varies from 200m to 865m from the mean sea level. There are three major distinct seasons in the district, the summer season from March to May, with maximum temperatures reaching up to 43 0C. The rainy season from June to October and winter season from November to February. The temperatures in winter season have a maximum of 250 C; and minimum temperatures between 3-5oC.
It is a tribal dominated district where it provides livelihood to around 36500 tribal (Dash, 2006). The district has characteristic vegetation and some of the salient features are that it lies amidst the central Indian Sal tract and broadleaved tress are a common sight. Sal is the dominant tree species found almost everywhere. Other predominant tree species are Palash (Butea monosperma) and Mahua (Madhuca indica). The northern slopes and valley have evergreen tree species. Southern slopes are adorned with thorny species which are rare, in combination with the white barked trees with gouty stems and deciduous foliage (Sha 2006). Champion & Seth (1968) classification of forests of India states that they fall in Moist Peninsular Valley Sal [3C/C2e (iii)] where natural regeneration is seen to be excellent and the tree composition varies with moisture due to variation of aspect, slope of the hill.
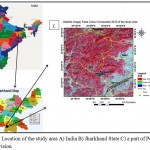 |
Figure 1: Location of the study area A) India B) Jharkhand State C) a part of Porhat forest division
|
Material and Methods
Multitemporal (1975, 1999 and 2015) images of Landsat satellite data were obtained from the USGS website where free download facility is available. The details of the satellite data are given in Table 1. The images were selected as they were cloud free. The satellite data was geometrically and radiometrically corrected. The vector layer of the study area was used to subset the images.
Table 1: Characteristics of satellite data utilized for the analysis
| Image Dates | 8-12-1975 | 29-11-1999 | 19-12-2015 |
| Spacecraft | Landsat 2 | Landsat 7 | Landsat 8 |
| Sensor | MSS | ETM+ | OLI_TIRS |
| Spatial resolution (meter) | 60 | 30 , 15 (PAN) | 30 , 15 (PAN) |
| Radiometric resolution | 8 bit | 8 bit | 16 bit |
| Number of bands | 4 | 8 | 11 |
| Path / Row | 151/44 | 140/44 | 140/44 |
| Projection | UTM | UTM | UTM |
| Zone | 45 | 45 | 45 |
| Datum | WGS84 | WGS84 | WGS84 |
| Ellipsoid | WGS84 | WGS84 | WGS84 |
The image processing was done in ERDAS Imagine software. The forest cover classes were delineated and maps were utilized to detect the changes. The prediction was based upon previously developed forest cover map. Detailed methodology is presented through a schematic flowchart in figure- 2. Further, forest cover change dynamics follows the definition given in figure 3.
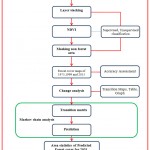 |
Figure 2: Schematic flowchart for predicting the changes in forest cover
|
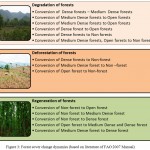 |
Figure 3: Forest cover change dynamics (based on literature of FAO 2007 Manual)
|
Image Processing and Classification
Image classification is the procedure of extracting the information class from multiband raster image and can be used to create various thematic maps. The Landsat images of the time periods 1975, 1999 and 2015 were further classified to obtain the forest cover classes. Firstly, to separate the vegetation from non-vegetation class we utilized the Normalized Difference Vegetation Index (NDVI).A non-forest mask was created. It was used to delineate forest area from false colour composite by masking the non-forest area. Secondly, within the forest area, unsupervised classification was executed for 30 classes (ISODATA clustering). This helps in delineating classes spectrally. Finally, the classes were merged to obtain three different classes (dense forest, medium forest and open forest). Water in the image was delineated separately using supervised classification method (the maximum likelihood classification (MLC) algorithm) by providing adequate training sets distributed uniformly throughout the image. Finally, all the classes delineated were merged in to obtain a final forest cover map using the model maker tool
Finally the forest was segregated into five forest cover classes of namely dense forest ( where canopy cover is greater than 70%), medium forest (canopy cover 40-70%), open forest (where canopy cover is 10 – 40% ), non-forest and water for all the datasets. A 3X3 filter was executed to smoothen the classified image and to remove noise. Accuracy assessment was analyzed by generating 250 random sampling points, and confirming them against ground truth data and literature. Overall accuracy and Kappa statistic were computed using the error matrix.
Forest Cover Change Detection Analysis
There are several change detection techniques; one among them most commonly used is the post classification comparison (Jensen 1996). In the present case post classification technique was adopted to study the changes over different time periods. Area statistics were calculated and various trends were noted. The gain, loss and net change for each forest cover category was also analyzed. The matrix was analyzed for understanding the forest cover change dynamics in terms of the deforestation, degradation and regeneration of the forest landscape.
Markov Chain Analysis
Markov chain analysis is named after the Russian mathematician Andrei Andreevich Markov (1856-1922). He developed the Markov chain as natural extension of sequences of independent random variables. A Markov chain analysis is that in which the state of system at time (t2) can be predicted purely on the basis of the immediate preceding state of a system at time (t1) (Thomas and Laurence, 2006). The Markov chain analysis describes the change of one forest cover to another and further utilizes this to predict the future change scenario. This type of modelling helps to understand the driving factors which are responsible for bringing about change. A visualization of future status of forest cover forms the basis for designing policy responses (Arsanji, 2013). A forest cover classified output for two time periods is required as an input to the Markov model. The first classified output is of 1999, time (t1) whereas the second input was of 2015, time (t2). The model assumes that future state (t2) can be determined by its current scenario (t1) as stated by Iacono et al., 2012. The process utilizes the transition matrix. The formula used is expressed as
vt2= M × vt1 1
Where vt1 is the forest cover proportion vector input, vt2 is the forest cover proportion vector output and M is the m×m transition matrix for the time difference Δt = t2 – t1. Forest cover area statistics were predicted for the year 2031.
Validation of the Model
Validation of the model was done by utilizing the transition matrix of the year 1975 and 1999 to predict 2023 forest cover area because it is a multiple of 24 year interval. The polynomial regression equation was generated for each forest cover class based on the forest cover area of 1975, 1999 and 2023. The area of forest cover for the year 2015 (figure 9) was interpolated based on this regression equation is given in the Table 8.
Results and Discussion
Forest Cover Change Analysis
The overall classification accuracy for the classified datasets were 90%, 92 % and 92% for the time periods 1975 , 1999 and 2015 respectively whereas kappa statistics was 0.86, 0.89 and 0.89 for the year 1975 , 1999 and 2015.
About 62% of the total surface of forest cover in the study area persisted without any change in between 1975 and 2015. During the entire study period (1975-2015) the area of dense forest decreased by 30663 ha where as other classes such as non-forest , medium forest and open forest indicated an increase in area by 10930 ha, 9500ha and 9942ha respectively. The loss in dense forest was observed as 950.82 ha per year in between 1975 to 1999. The loss in dense forest and medium forest was noted as 490.21 and 288ha per year respectively in between 1999 to 2015. A decreasing trend was noticed in the case of the dense forest which was approximately 50%, 33% and 27% of the study area in 1975, 1999 and 2015 respectively, Table-2 and Figure -4.
Table 2: Forest cover area in hectares and its percentage
| Forest cover area statistics for the year 1975, 1999 and 2015 | ||||||
| Forest cover types | Area( ha)1975 | Area Percent | Area
( ha)1999 |
Area Percent | Area( ha)2015 | Area Percent |
| Water | 160.38 | 0.11 | 311.22 | 0.22 | 450 | 0.32 |
| Non Forest | 53946.18 | 38.04 | 56328.48 | 39.71 | 64876.68 | 45.74 |
| Dense Forest | 70084.26 | 49.41 | 47264.58 | 33.33 | 39421.17 | 27.79 |
| Medium Forest | 13214.7 | 9.32 | 27320.4 | 19.26 | 22715.28 | 16.02 |
| Open Forest | 4432.14 | 3.12 | 10612.98 | 7.48 | 14374.53 | 10.13 |
| Total | 141837.66 | 100 | 141837.66 | 100 | 141837.66 | 100 |
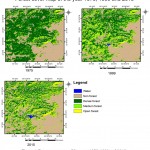 |
Figure 4: Forest cover map of the years 1975, 1999 and 2015
|
The gain, loss and the net change for each forest cover class that occurred between 1975 to 1999 and 1999 to 2015 in percentage of the study area is given in figure-5. The dense forest class is continuously declining. The net change (loss) in dense forest was 16% in between 1975 to 1999. The net change (loss) of dense forest and medium forest classes were 5.5 % and 3.2 % and a gain in non-forest class was 6% in between 1999 to 2015.
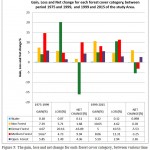 |
Figure 5: The gain, loss and net change for each forest cover category, between various time Periods
|
Forest Cover Transition Matrix Analysis
This section analyses the forest cover change transitions from one year to the other. This is done to ascertain the degree of change and the intensity of change in transitions from one class of forest cover to the other, over the period spanning between the two image years. The deforestation, degradation and regeneration of dense forest were evaluated based on the matrix given in the Table 3, Table 4 and Table 5.
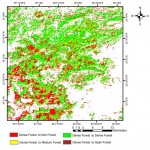 |
Figure 6: Dense forest transition between the periods 1975 to 2015
|
Table 3: Forest cover matrix between 1975 to 1999
| Forest cover area matrix between 1975 to 1999 | |||||||
| 1975
|
1999 | ||||||
| Forest cover types | Water | Non Forest | Dense Forest | Medium Forest | Open Forest | Total Area (ha) 1975 | |
| Water | 56.25 | 103.68 | 0.09 | 0.27 | 0.09 | 160.38 | |
| Non Forest | 223.74 | 45840.78 | 2895.93 | 4021.65 | 964.08 | 53946.18 | |
| Dense Forest | 30.15 | 9529.29 | 41485.86 | 15068.34 | 3970.62 | 70084.26 | |
| Medium Forest | 1.08 | 673.2 | 2668.41 | 6507.54 | 3364.47 | 13214.7 | |
| Open Forest | 0 | 181.53 | 214.29 | 1722.6 | 2313.72 | 4432.14 | |
| Total Area (ha) 1999 | 311.22 | 56328.48 | 47264.58 | 27320.4 | 10612.98 | 141837.66 | |
Table 4: Forest cover matrix between 1999 to 2015
| Forest cover area matrix between 1999 to 2015 | |||||||
| 1999
|
2015 | ||||||
| Forest cover types | Water | Non Forest | Dense Forest | Medium Forest | Open Forest | Total Area (ha) 1999 | |
| Water | 134.1 | 176.13 | 0.9 | 0.09 | 0 | 311.22 | |
| Non Forest | 272.97 | 49771.35 | 3145.5 | 2403.99 | 734.67 | 56328.48 | |
| Dense Forest | 19.17 | 7198.56 | 32333.04 | 6859.35 | 854.46 | 47264.58 | |
| Medium Forest | 21.06 | 5857.02 | 3818.97 | 11278.98 | 6344.37 | 27320.4 | |
| Open Forest | 2.7 | 1873.62 | 122.76 | 2172.87 | 6441.03 | 10612.98 | |
| Total Area (ha) 2015 | 450 | 64876.68 | 39421.17 | 22715.28 | 14374.53 | 141837.66 | |
Table 5: Forest cover matrix between 1975 to 2015
| Forest cover area matrix between 1975 to 2015 | |||||||
| 1975
|
2015 | ||||||
| Forest cover types | Water | Non Forest | Dense Forest | Medium Forest | Open Forest | Total Area (ha) 1975 | |
| Water | 3.96 | 156.06 | 0 | 0.18 | 0.18 | 160.38 | |
| Non Forest | 363.87 | 45559.8 | 3534.39 | 3493.98 | 994.14 | 53946.18 | |
| Dense Forest | 76.77 | 17859.87 | 34442.82 | 13384.98 | 4319.82 | 70084.26 | |
| Medium Forest | 4.59 | 1066.95 | 1305.09 | 5174.37 | 5663.7 | 13214.7 | |
| Open Forest | 0.81 | 234 | 138.87 | 661.77 | 3396.69 | 4432.14 | |
| Total Area (ha) 2015 | 450 | 64876.68 | 39421.17 | 22715.28 | 14374.53 | 141837.66 | |
Forest Cover Change Transition from 1975 to 1999
Dense Forest
About 59 % of the total dense forest in the study area is noted to have no change in between 1975 and 1999. The loss in dense forest between the periods 1975 to 1999 was translated to roughly one third by non-forest class and the rest two thirds by the medium and the open forest classes. The gain in dense forest which can be attributed to regeneration was approximately one fifth of loss of dense forest between the same period.
Medium Forest and Open Forest
About 49 % and 52% of the total, medium forest and the open forest respectively of the study area persist without any change in between the same base period. The gain in medium forest between the period 1975 to 1999 is contributed by the conversion of dense forest to medium forest (dense forest degradation) as well as due to the regeneration in the open forest and non-forest.
The total medium forest was 27320 ha in 1999 whereas 15068 ha gain was observed. This was contributed by the conversion of dense forest to medium forest. The increase in medium forest was 5744 ha over the same period. This can be attributed to the regeneration of species in open forest and conversion of non-forest to medium forest.
The increase in open forest class between the period 1975 to 1999 was mostly due to the degradation of dense and medium forest to open forest as well as due to the regeneration in the non-forest. The total open forest area was 10612 ha in 1999, an increment was noticed of 7335 ha which was translated from dense forest and medium forest whereas, an increase of 964 ha was due to the regeneration in non-forest over the same time period.
Forest Cover Change Transitions from 1999 to 2015
Dense Forest
About 68.4 % of the total dense forest of the study area exhibits no change in between 1999 and 2015. The loss of the dense forest between the period 1999 to 2015 was translated to non-forest (48%), medium forest (46%) and open forest (6%) and water. The dense forest which is a result of regeneration (gain) was approximately half of loss of dense forest between the same period (Table 4).
Medium Forest, Open Forest
About 41.2 % and 60.7% of the total, medium forest and open forest respectively of the study area remained same without any change in between the same base period. The gain in medium forest class increased between the period 1999 to 2015 slowly but the rate of conversion decreased mostly due to less conversion of dense forest to medium forest (dense forest degradation) when compared with the previous time period 1975 to 1999. The total medium forest was 22715 ha in 2015 whereas 6859 ha gain was observed which can be attributed to conversion of dense forest to medium forest. The regeneration contribution (gain in medium forest) from open forest and non-forest to medium forest was 4577 ha over the same period.
Forest Cover Change Transitions from 1975 to 2015
About 49.1 %, 39.2% and 76.6 % of the total dense forest, medium forest and open forest respectively in the study area persisted without any change in between 1975 to 2015. The loss in the dense forest class between the period 1975 to 2015 is translated to by non-forest (50%), by medium (37%) and by open forest (13%) and water. The dense forest regenerated (gain) was approximately one seventh of the loss of dense forest between the same period (Table 5 and Figure 5).
Forest Cover Change Prediction with Markov Chain Analysis
The analysis of the past changes in forest cover distributions with regard to spatial descriptive variables enables to assess the degree to which locations might likely change in the future. Markov analysis was performed for the multi-temporal images of 1999-2015 including predicting for 2031 as shown in table 7 using the transition matrix given in the table 6. The results of the Markov models are focused predominantly on providing the information of how much, where, what type of forest cover changes has occurred from 2015 to 2031. The dense forest is showing the decreasing trend from 39421 ha to 33933 ha whereas the non-forest area is showing the increasing trend from 64876 ha to 70990 ha over the period from 2015 to 2031.
Table 6: Markov transition probability matrix used for prediction of year 2031
| Markov transition probability matrix used for prediction of year 2031 | |||||||
| 1999
|
2015 | ||||||
| Forest cover types | Water | Non Forest | Dense Forest | Medium Forest | Open Forest | ||
| Water | 0.4309 | 0.5659 | 0.0029 | 0.0003 | 0 | ||
| Non Forest | 0.0048 | 0.8836 | 0.0558 | 0.0427 | 0.013 | ||
| Dense Forest | 0.0004 | 0.1523 | 0.6841 | 0.1451 | 0.0181 | ||
| Medium Forest | 0.0008 | 0.2144 | 0.1398 | 0.4128 | 0.2322 | ||
| Open Forest | 0.0003 | 0.1765 | 0.0116 | 0.2047 | 0.6069 | ||
Table 7: Predicted Forest cover area matrix between 2015 to 2031
| Predicted forest cover area matrix between 2015 to 2031 | |||||||
| 2015
|
2031 | ||||||
| Forest cover types | Water | Non Forest | Dense Forest | Medium Forest | Open Forest | Total Area (ha) 1975 | |
| Water | 193.90 | 254.67 | 1.30 | 0.13 | 0 | 450 | |
| Non Forest | 314.39 | 57324.46 | 3622.85 | 2768.81 | 846.16 | 64876.68 | |
| Dense Forest | 15.99 | 6003.98 | 26967.47 | 5721.06 | 712.67 | 39421.17 | |
| Medium Forest | 17.51 | 4869.76 | 3175.25 | 9377.80 | 5274.96 | 22715.28 | |
| Open Forest | 3.66 | 2537.69 | 166.27 | 2943.00 | 8723.92 | 14374.53 | |
| Total Area (ha) 2015 | 545.449 | 70990.56 | 33933.19 | 20810.80 | 15557.71 | 141837.66 | |
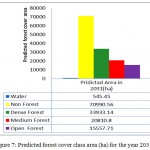 |
Figure 7: Predicted forest cover class area (ha) for the year 2031
|
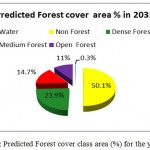 |
Figure 8: Predicted Forest cover class area (%) for the year 2031
|
The Validation (Predicted vs Observed)
The percentage error (True value Vs. Predicted) for forest cover classes as water, non-forest, dense forest, medium forest and open forest was 20.08, 12.76, 1.13, 38.7 and 0.15 %, respectively. The true value (actual) of medium forest area 8791 ha was lower than that was predicted, whereas non forest area 8275 ha was higher than the predicted.
This indicates that the anthropogenic pressure on the medium and the open forest was more than we assumed based on the transition matrix (1975-1999).This can also be validated with figure 4, especially in the south west part of the study area where intensive agricultural activity on the forest land at lower slope, adjacent to the streams was observed. The open forest area exhibited less variation because on one hand the open forest was converted into non-forest area, whereas on the other hand. it is compensated by the conversion of medium forest to open forest. The variation in the area of the dense forest is less because it is inaccessible due to the terrain complexity. The area covered by water is showing an increasing trend because the Pansuan dam was not constructed in the year 1975; it came later as is visible in the year 1999 (Fig 4).
Table 8: Regression equation of forest cover used for prediction for the year 2015
| Forest cover | Regression polynomial equation used for prediction for the year 2015 |
| Water | y = -48.36x2 + 295.92x – 87.18 R² = 1 |
| Non Forest | y = -1195.7x2 + 5969.5x + 49172 R² = 1 |
| Dense Forest | y = 6293.4x2 – 41700x + 105491 R² = 1 |
| Medium Forest | y = -4742.8x2 + 28334x – 10377 R² = 1 |
| Open Forest | y = -306.56x2 + 7100.5x – 2361.8 R² = 1 |
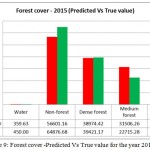 |
Figure 9: Forest cover -Predicted Vs True value for the year 2015
|
Conclusion
The study was made using multitemporal Landsat data to identify, classify and interpret the changes in forest cover for the part of Saranda forest, in West Singbhum district of State of Jharkhand. The beautiful dense forest consisting of Sal trees are rapidly decreasing due to deforestation and degradation where as non-forest area is increasing. The dense forest is showing the decreasing trend from 70084 ha to 39421 ha whereas the non-forest area is showing an increasing trend from 39421ha to 53946 ha over the period from 1975 to 2015.
The main drivers of forest loss in this region are attributed to the factors like illegal felling of economic important species, grazing and unscientifically exploited. The tribes here practice agriculture as their main livelihood. It is observed that a large part of the plateau is covered by cultivated fields along with isolated villages, which are in proximity to the roads and railways. Thus disturbance is more and anthropogenic pressure on forests too. An approach for conservation of these forests is necessary such that they continue to provide various services. These forests are a home to various wild life species and medicinal plants. Dense forests should not be disturbed any more, infrastructural activities should be limited such areas. Medium dense and open forests are protected such that their canopy levels are increased towards dense forest, silviculture programmes can assist in this regard by accelerating the regeneration processes. Community participation and engagement of tribal people should be encouraged to achieve the target. An alternative source of livelihood for the native dwellers should be created.
The prediction for the future based on Markov chain analysis for the year 2031 shows that the forests are likely to degrade continuously and further deforestation is feared. Non forest areas will increase dominating the landscape. The potential satellite remote sensing and analysis in GIS domain was established in this study. Such analysis and data should be incorporated in decision making by the stakeholders and policy makers to maintain the integrity of the forests so that they can provide various services and benefits to mankind.
Acknowledgement
The authors are grateful to USGS portal for providing the LANDSAT data for the analysis.
List of Abbreviations
FAO – Food and Agriculture Organization
FSI – Forest Survey of India
WHO – World Health Organization
GIS – Geographic Information System
AHP – Analytical Hierarchical Procedure
MCA – Markov Chain Analysis
USGS – United States Geological Survey
DEM – Digital elevation model
FCC – False colour composite
GPS – Global Positioning System
NDVI – Normalized Difference Vegetation Index
PAN – Panchromatic
MLC – Maximum Likelihood Classification
ISFR – Indian State of Forest Report
LULC – Land Use Land cover
References
- Abdalla M., Saunders M., Hastings A., Williams M., Smith P., Osborne B., Lanigan G., Jones M. B. Simulating the impacts of land use in Northwest Europe on Net Ecosystem Exchange (NEE): The role of arable ecosystems, grasslands and forest plantations in climate change mitigation. Science of the Total Environment. 2013;465:325–336.
CrossRef - Adhikari S., Southworth J. Simulating forest cover changes of Banerghatta National Park based on CA Markov model aremote sensing approach. Remote Sensing. 2012;4:3215–3243.
CrossRef - Akingbogun A. A., Oloyede S. O., Aborisade K. Remote Sensing and GIS application for forest reserve degradation prediction and monitoring. First FIG Young Surveyors Conference Knowing to create the Future Rome, Italy. 2012;4-5.
- Antwi E. K., Boakye-Danquah J., Asabere S. B., Takeuchi K., Wiegleb G. Land cover transformation in two post-mining landscapes subjected to different ages of reclamation since dumping of spoils. Springer plus. 2014;3(1):702.
CrossRef - Bhatta B., Saraswati S., Bandyopadhyay D. Quantifying the degree-of-freedom, degree-of-sprawl and degree-of-goodness of urban growth from remote sensing data. Applied Geography. 2010;30:96–111.
CrossRef - Cabrera V. A., Vilalta M. J. Patterns of forest decline and regeneration across scots pine populations. Ecosystems. 2013;16:323–335.
CrossRef - Celine E., Phlippe M., Astrid V., Catherine B., Musampa C., Pierre D. National forest cover change in Congo Basin: deforestation, reforestation, degradation and regeneration for the years 1990, 2000 and 2005.Global Change Biology. 2013;19:1173–1187.
CrossRef - Champion H. G., Seth S. K. A Revised Survey of the Forest Types of India, Published by Govt. of India Press, New Delhi. 1968.
- Chen F. C., Son T. N., Chang B. N., Chen R. C., Chang Y. L., Valdez M., Centeno G., Thompson A. C., Aceituno L. J. Multidecadal mangrove forest change detection and prediction in Honduras, Central America, with Landsat imagery and a Markov chain model. Remote Sensing. 2013;5:6408–6426.
CrossRef - Dale V. H. The relationship between land-use change and climate change. Ecological Application. 1997;7:753–769.
- Dash S. Naxal movement and state power, New Delhi: Sarup and Sons. 2006.
CrossRef - FAO Report 1997ftp://ftp.fao.org/docrep/fao/W7716E/W7716E00.pdf
- Fonji S. F., Taff G. N. Using satellite data to monitor land-use land-cover change in North-eastern Latvia. Springer plus. 2014;3(1):61 DOI: 1186/2193-1801-3-61.
- Giriraj A., Ullah M. I., Murthy M. S. R., Beierkuhnlein C. Modelling Spatial and Temporal Forest Cover Change Patterns (1973-2020): A Case Study from South Western Ghats (India). Sensors. 2008;8:6132-6153.
CrossRef - Indian State of Forest Report (ISFR), Forest Survey of India (FSI), Ministry of Environment Forests and climate change. Dehradun, Uttarakhand, India. 2015.
- Jensen J. R. Introductory digital image processing a remote sensing perspective. Prentice-Hall, Upper Saddle River, NJ. 1996;318.
- Kabba S. T. V., Li J. Analysis of land use and land cover changes, and their ecological implications in Wuhan, China. Journal of Geography and Geology. 2011;3:104–118.
CrossRef - Kayet N., Pathak K. Remote Sensing and GIS Based Land use/Land cover Change Detection Mapping in Saranda Forest, Jharkhand, India. International Research Journal of Earth Sciences. 2015;3(10).
- Khoi D. D., Murayama Y. Forecasting Areas Vulnerable to forest conversion in the Tam Dao National Park Region, Vietnam. Remote Sensing. 2010;2:1249-1272. doi:10.3390/rs2051249.
CrossRef - Lambin F. E., Meyfroidt P. Global land use change, economic globalization, and the looming land scarcity. Proceedings of the National Academy of Sciences. 2011;108:3465–3472.
CrossRef - Leuzinger S.,Luo Y.,Beier C.,Dieleman W.,Vicca S.,Körner C. Do global change experiments over estimate impacts on terrestrial ecosystems? Trends in Ecology and Evolution. 2011;26:236–241.
CrossRef - Mabwoga S. O., Thukral A. Characterization of change in the Harike wetland, a Ramsar site in India, using Landsat satellite data. Springer Plus. 2014;3(576):1-11.
CrossRef - Mahmood R., Pielke R. A Sr., Hubbard K. G., Niyogi D., Bonan G., Lawrence P., McNider R., McAlpine C., Etter A., Gameda S., Qian B., Carleton A., Beltran-Przekurat A., Chase T., Quintanar A. I., Adegoke J. O., Vezhapparambu S., Conner G., Asefi S., Sertel E., Legates D. R., Wu Y., Hale R., Frauenfeld O. W., Watts A., Shepherd M., Mitra C., Anantharaj V. G., Fall S., Lund R., Trevino A., Blanken P., Du J., Chang H. I., Leeper R., Nair U. S., Dobler S., Deo R., Syktus J. Impacts of land use/land cover change on climate and future research priorities. Bull Am Meteorol Soc. 2010;91(1):37–46.
CrossRef - Moghadam H. S., Helbich M. Spatiotemporal urbanization process in mega city of Mumbai, India : A Markov chains- cellular automata urban growth model. Applied Geography. 2013;40:140-149.
CrossRef - Oludare H. A., Opeyemi O., Tope-Ajayi., Olukemi L. A. Assessing and Predicting Changes in the Status of Gambari Forest Reserve, Nigeria Using Remote Sensing and GIS Techniques. Journal of Geographic Information System. 2015;7:301-318.
CrossRef - Pal M., Mather P. M. Assessment of the effectiveness of support vector machines for hyperspectral data. Future Gener. Comput. Syst. 2004;20:1215–1225.
CrossRef - Peled A., Gilichinsky M. GIS-driven classification of land use using IKONOS data and a core national spatial information database. Appl Geomatics. 2013;5(2):109–117.
CrossRef - Ridder R. M. Options and recommendations for a global remote sensing survey of forests. Working paper. Rome, FAO. 2007;14.
- Sha N. The West Singhbhum district general description population electricity drinking water toilets percentage having owning a house number facility statistics of West Singhbhum district (including new districts of Saraikela Kharsawan. Forest Resource Survey, Chaibasa south Introduction. 2006;1.
- Thomas H., Laurence H. M. Modeling and projecting land-use and land-cover changes with Cellular Automaton in considering landscape trajectories: An improvement for simulation of possible future state. EARAeLeProc. 2006;563-76.
- Turner M. Landscape ecology in North America: Past, present and future. Ecology. 2005;86:1967–1974.
CrossRef - Watson R. T., Noble I. R., Bolin B., Ravindranath N. H., Verardo D. J., Dokken D. J. Land Use, Land-Use Change and Forestry: A Special Report of the Intergovernmental Panel on Climate Change, 1st ed. Cambridge University Press: Cambridge, UK. 2000;388.
- globalforestwatch.com
- Ye Y., Fang X. Spatial pattern of land cover changes across Northeast China over the past 300 years. J Hist Geogr. 2011;37(4):408–417.
CrossRef - Yu W., Zang S., Wu C., Liu W., Na X. Analyzing and modeling land use land cover change (LUCC) in the Daqing city, China. Applied Geography. 2011;31(2):600–608. https://doi.org/10.1016/j.landurbplan.2006.03.008
CrossRef - Yu X. J., Ng C. N. Spatial and temporal dynamics of urban sprawl along two urban-rural transects a case study of Guangzhou, China. Landscape and Urban Planning . 2007;79:96–109.
CrossRef - Brambilla M., Casale F., Bergero V., Bogliani G., Crovetto G. M., Falco R. Roati M., Negri I. Glorious past, uncertain present, bad future? Assessing effects of land-use changes on habitat suitability for a threatened farmland bird species. Biol. Conserv. 2010;143:2770–2778.
CrossRef - Angelsen A., Kaimowitz D. Rethinking the causes of deforestation: lessons from economic models. World Bank Res. Obs. 1999;14:73–98.
CrossRef - Food and Agriculture Organization (FAO). Global Forest Resources Assessment 2010; Food and Agriculture Organization of the United Nations: Rome, Italy, Available online: http://www.fao.org/forestry/fra/fra2010/en/ (accessed on 12 September 2012). 2010.
- Food and Agriculture Organization (FAO). State of the world’s forest, enhancing the socio-economic benefits from forests.Rome. 2014
- Tang J., Wang L., Zhang S. Investigating landscape pattern and its dynamics in Daqing, China. Int. J. Remote Sens. 2005;26:2259–2280. [CrossRef] 21. Read J.M., Lam N. S. Spatial methods for characterizing land cover and detecting land-cover changes for the tropics. Int. J. Remote Sens. 2002;23:2457–2474. [CrossRef]
- Coppin P.,Jonckheere I.,Nackaerts K.,Muys B.,Lambin E. Digital changed etectionmethodsinecosystem monitoring: A review. Int. J. Remote Sens. 2004;25:1565–1596. [CrossRef]
- Brown D. G., Walker R., Manson S., Seto K. Chapter 23: Modeling land use and land cover change. In: Gutman, G., Janetos A., Justice C., Moran E., Mustard J., Rindfuss R., Skole D., Turner B., Cochrane M. (Eds.), Land Change Science: Observing, Monitoring and Understanding Trajectories of Change on the Earth’s Surface. Kluwer Dordrecht. 2004;395–409.
- Sturtevant B. R., Fall A., Kneeshaw D. D., Simon N. P., Papaik M. J., Berninger K., Doyon F., Morgan D.G., Messier C. A toolkit modeling approach for sustainable forest management planning: achieving balance between science and local needs. Ecology and Society 2007;12(2). In: http://www.ecologyandsociety.org/vol12/iss2/art7/.
- Guisan A., Zimmermann N. E. Predictive habitat distribution models in ecology. Ecological Modelling. 2000;135:147–186.
CrossRef - Iacono M., Levinson D., El-Geneidy A and Wasfi R. A Markov Chain Model of Land Use Change in the Twin Cities. 2012;1958-2005. http://nexus.umn.edu/papers/MarkovLU.pdf.
- Arsanjani J. J., Helbich M., Kainz W and Boloorani A. D. Integration of Logistic Regression, Markov Chain and Cellular Automata Models to Simulate Urban Expansion. International Journal of Applied Earth Observation and Geoinformation. 2013;21:265-275.
CrossRef - Reddy C. S., Singh S., Dadhwal V. K., Jha C. S., Rao N. R., Diwakar P. G. Predictive modelling of the spatial pattern of past and future forest cover changes in India. Journal of Earth System Science. 2017;126(8):1-16.
CrossRef

This work is licensed under a Creative Commons Attribution 4.0 International License.


