

Manuscript accepted on : 03 August 2017
Published online on: --
Plagiarism Check: Yes
Roopma Gandotra, Rizwan uz zaman and Vivek
Department of zoology, University of Jammu, Jammu 180006.
Corresponding Author E-mail: researcherizu@gmail.com
DOI : http://dx.doi.org/10.13005/bbra/2550

ABSTRACT: The present study, was carried out to investigate the diversity and assemblage structure of ichthyofauna of bothupstream and downstream section of river Tawi from four different sections i.e. Station I (Chenani), Station II (Jhajjar kotli),Station III (Nagrota), and Station IV (Gujjar Nagar).The sampling was done from January 2016 to December 2016. The results of present investigation revealed the occurrence of twenty one fish species in all the study stations belonging to five orders viz. Cypriniformes, Mastacembeliformes, Synbranchiformes, Perciformes & Siluriformes and 6 families i.e. Cyprinidae, Nemachilidae, Mastacembelidae, Chinnidae, Sisuridae and Bagaridae. In all the study stations Cyprinidae was found to be dominant(62%)followed by family Nemacheilidae,(9%) Mastacembelidae, (9%) Channidae, (10%) Sisuridae and Bagaridae showed least contribution of 5% each. The fish diversity indices i.e. Shannon weiner (H) and Evenness (e) at all the stations were 1.286 & 0.7234, 1.662 & 0.753, 1.959 & 0.5454 and 1.978 &0.4252 at station I, II, III and IV respectively.
KEYWORDS: assemblage structure; Fish diversity; Ichthyofauna; Tawi river
Download this article as:| Copy the following to cite this article: Gandotra R, zaman R. U, Vivek V. Longitudinal Patterns of Population Structure for Fishes Inhabiting River Tawi in Jammu Region. (J and K). Biosci Biotech Res Asia 2017;14(3). |
| Copy the following to cite this URL: Gandotra R, zaman R. U, Vivek V. Longitudinal Patterns of Population Structure for Fishes Inhabiting River Tawi in Jammu Region. (J and K). Biosci Biotech Res Asia 2017;14(3). Available from: https://www.biotech-asia.org/?p=26982 |
Introduction
Fishes are the major component of an aquatic ecosystem, as they provide the nutritious and delicious food for mankind. They are indicator of aquatic health,and also play significant role in ecosystem preservation. They play major role in enhancing the economy of nation. India is one of the mega bio-diversity countries in the world, and occupies 9th position in term of fresh water diversity. In India there are 2,500 species of fishes of which 930 live in fresh water and 1,570 are marine (Kar et al, 2003).
The share of riverine fisheries in total inland fish production may not be significant, but being the prime source of original fish germ plasm, their role becomes crucial for conservation of fish diversity.More over, millions of fisherman and their families depend on rivers for their livelihood. Rivers, the life line of our country are a vast repository of unmatched biological wealth. With catchment areas of 3. 12 million sq. kms, 14 large (covering 18.3% of drainage area) and 44 medium and minor river system are characterized by highly diverse aquatic communities.
Biological communities reflect the pattern of habitats. In smaller headwater areas and small specialized habitat features, the variety of species may be small. As the size and complexity of habitats incease so too the potential size and variability of fish community. Within the river system, the number and types of species will fluctuate with the variability of habitats. Modification of river system can have serious implications for the sustainability of communities. Dams, water withdrawal, canalization, pollution, modifications of erosion and deposition patterns, and other features contribute to an alteration in the pattern and quality of habitat.
J&Kregion is endowed with potentially rich and varied aquatic resources amendable for fisheries. Most of the area encompasses hill regions from where the rivers, streams and its tributaries meandered in plains and valleys. More over, these hill streams are in more precarious conditions as regard to their ecological status because of their metas table eco-geography.
Since most of lotic water bodies in upper reaches of Jammu region have not thoroughly being explored, with hardly any information regarding the fish composition, distribution and population dynamics, primarily on account of inaccessibility to these regions due to presence of deep gorges, narrow valleys and due to meager transport facilities.
Thus, regular documentation and management of fresh water fishery of these sensitive lotic water bodies requires immediate attention to access the ecosystem health, fish community structure, and distribution patterns and to develop management and conservation strategies. Therefore, the present research work has been designed to raise first-hand information on various aspects of population structure in the various sections of river Tawi.
Materials and Methods
Site Selection
To study the ichthyofaunal diversity of the river Tawi fish samples were collected from fourdifferent habitat variables in thevarious sections of river Tawi. viz., station I (Chenani), situated at 32˚57 ̓ 20.45 ̋N latitude and 75˚ 9 ̛59.38 ̋E longitude, station II (Jhajjarkotli), 32˚ 53̛ 48.30 ̋ N latitude and 74˚ 57 ̛ 37.90 ̋E longitude, station III (Nagrota),32˚ 47 ̛ 2.92 ̋N latitude and74˚55 ̓39.48 ̋ E longitude, station IV (Gujjar Nagar),32˚ 43 ̓ 31.45 ̋N latitude and 74˚ 52̕19.72 ̋E longitude.
Collection and Identification
During present study fishes were monthly captured from January to December 2016 by using different types of nets i.e. cast net,drag net, hand/dip net.Collected fish samples were preserved in 10 % formalin for detailed examination.
The collected specimens were sorted at species level and all the species obtained were counted. Species identification and confirmation were carried out using available literature (Day, 1958; Talwar and Jhingran, 1991;Jayaram 1999).
Population Studies
Information on structure of fish assemblage was extracted by using different univariate indices, namely Shannon diversity index, Simpson index, Margalef Index and Evenness Index.
Shannon’s Diversity Index (H)
H=-∑pi In pi
Pi=ni/N
Ni=Number of individuals of each species in the Sample.
N=Total number of individuals of all species in the sample
Simpson’s Index (D)
D=∑ (n-1)/N (N-1)
n=the total number of organisms of a particular species.
N=the total number of organisms of all species.
Margalef’s Index
Margalef’s index was used as a simple measure of species richness (Margalef, 1958).
Margalef’s index = (S – 1)
S = total number of species
N = total number of individuals in the sample
In = natural logarithm
Pielou’sEveness
For calculating the evenness of species, the Pielou’s
Evenness Index (e) was used (Pielou, 1966).
e = H / In S
H = Shannon – Weaver diversity index
S = total number of species in the sample.
Results and Discussion
During the present investigation, for a period of one year (January 2016 to December 2016) a total of 21 fish species belonging to five orders viz. Cypriniformes, Mastacembeliformes, Synbranchiformes, Perciformes and Siluriformes and 6 families i.e. Cyprinidae, Nemachilidae, Mastacembelidae, Chinnidae, Sisuridae and Bagaridae including variety of fishes were present i.e. Cold water, warm water, food fishes and ornamental fishes etc. In all the study stations Cyprinidae was found to be dominant (62%)followed by family Nemacheilidae, (9%) Mastacembelidae, (9%) Channidae, (10%) Sisuridae and Bagaridae showed least contribution of 5% eachrepresenting single species. Dominance of Cyprinids in the assemblage structure, as seen during the present study, was due to their high adaptive variability to occupy all possible habitats and presence of appropriate environment, river bottom, depth, water current and food abundance etc for cyprinids which is in accordance with the observations of Dass and Nath (1966), Dutta and Malhotra,(1984), Dutta et al. (2002),Kaur (2006), Mishra et al, (2013), Andotra (2014), Gandotra and Poonam (2015), Vivek (2016) and Abdul razak et al. (2017). (Table1-4 & fig 1-4).
Table 1: Showing fish abundance and percentage at station I (Chenani).For the year January to December 2016. (Upstream).
| S.N0 | Fish species | Family | Total Abundance | % |
| 1 | Garra gotyla (Gray) | Cyprinidae | 55 | 51.88 |
| 2 | Schizothorax richardsonii (Gray) |
Cyprinidae |
19 | 17.92 |
| 3 | Labeo boga
(Ham Buch) |
Cyprinidae | 18 | 16.98 |
| 4 | Tor putitora
(Ham Buch) |
Cyprinidae | 11 | 10.37 |
| 5 | Schistura montanus (Clelland) | Nemacheilidae | 3 | 2.83 |
| Total | 106 | |||
Table 2: Showing fish abundance and percentage at station II (Jhajjar kotali). For the year January to December 2016.
| S.NO | Species | Family | Total Abundance | % |
| 1 | Labeo boga
(Ham Buch) |
Cyprinidae | 168 | 23.56 |
| 2 | Tor putitora
(Ham Buch) |
Cyprinidae | 161 | 22.58 |
| 3 | Barilius vagra
(Ham Buch) |
Cyprinidae | 145 | 20.33
|
| 4 | Garra gotyla (Gray) | Cyprinidae | 142 | 19.91
|
| 5 | Puntius ticto
(Ham Buch) |
Cyprinidae | 83 | 11.64
|
| 6 | Bagarius yarrellii(Ham Buch) | Sisoridae | 9 | 1.26
|
| 7 | Mastacembelus pancalus
(Ham Buch) |
Mastacembelidae | 5 | 0.70 |
| Total | 713 | |||
Table 3: Showing Fish abundance and percentage at station III (Nagrota). for the year January 2016-December 2016.
| S.No | Fish species | Family | Total Abundance | % |
| 1 | Barilius vagra (Ham Buh) | Cyprinidae | 260 | 31.90 |
| 2 | Puntius conchonius (Ham Buch) | Cyprinidae | 149 | 18.28 |
| 3 | Aspidoparia morar (Ham Buch) | Cyprinidae | 118 | 14.47 |
| 4 | Tor putitora (Ham Buch) | Cyprinidae | 99 | 12.14 |
| 5 | Crossocheilus latius (Ham Buch) | Cyprinidae | 15 | 1.840 |
| 6 | Garra gotyla (Gray) | Cyprinidae | 52 | 6.380 |
| 7 | Barilius bendelisis (Ham Buch) | Cyprinidae | 44 | 5.398 |
| 8 | Labeo boga (Ham Buch) | Cyprinidae | 16 | 1.963 |
| 9 | Puntius ticto (Ham Buch) | Cyprinidae | 13 | 1.595 |
| 10 | Schizothorax richardsonii (Gray) | Cyprinidae | 1 | 0.122 |
| 11 | Labeo bata (Ham Buch | 1 | 0.122 | |
| 12 | Puntius sophore (Ham Buch | Cyprinidae | 4 | 0.490 |
| 13 | Nemacheilus botia (Ham Buch) | Nemacheilidae | 43 | 5.276 |
| Total | 815 | |||
Table 4: Showing Fish abundance and percentage at station IV (Gujjar Nagar).for the year January 2016-December 2016 (Downstream).
| S.No | Fish species | Family | Total Abundance. | % |
| 1 | Puntius conchonius (Ham Buch) | Cyprinidae | 325 | 33.78 |
| 2 | Barilius vagra (Ham Buch) | Cyprinidae | 25 | 2.59 |
| 3 | Puntiusticto (Ham Buch) | Cyprinidae | 223 | 23.18 |
| 4 | Aspidopariamorar (Ham Buch) | 122 | 12.68 | |
| 5 | Bariliusbendelisis (Ham Buch) | Cyprinidae | 97 | 10.08 |
| 6 | Puntiussophore (Ham Buch) | Cyprinidae | 50 | 5.19 |
| 7 | Labeoboga (Ham Buch) | Cyprinidae | 31 | 3.22 |
| 8 | Crossocheiluslatius (Ham Buch) | Cyprinidae | 20 | 2.07 |
| 9 | Labeodero (Ham Buch) | Cyprinidae | 6 | 0.62 |
| 10 | Garragotyla(Gray) | Cyprinidae | 4 | 0.41 |
| 11 | Tor putitora (Ham Buch) | Cyprinidae | 13 | 1.35 |
| 12 | Nemachilusbotia (Ham Buch) | Nemacheilidae | 8 | 0.83 |
| 13 | Mystusseenghala (Skyes) | Bagridae | 7 | 0.72 |
| 14 | Mastacembeluspuncalus (Hamilton) | Mastacembelidae | 7 | 0.72 |
| 15 | Mastacembelusarmatus (Lacepede) | Mastacembelidae | 3 | 0.31 |
| 16 | Channapunctatus (Bloch) | Channidae | 14 | 1.45 |
| 17 | Channastriatus(Bloch) | Channidae | 7 | 0.72 |
| Total | 962 | |||
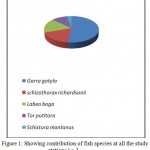 |
Figure 1: Showing contribution of fish species at all the study stations i.e. I.
|
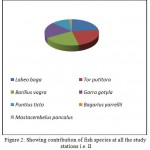 |
Figure 2: Showing contribution of fish species at all the study stations i.e. II.
|
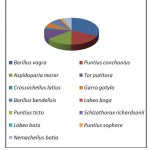 |
Figure 3: Showing contribution of fish species at all the study stations i.e. III.
|
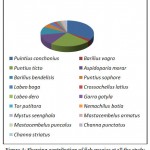 |
Figure 4: Showing contribution of fish species at all the study stations i.e. IV.
|
Station wise data of fish abundance revealed that at Station I (Chenani) 5 fish species were collected (H=1.286) i.e. Garragotyla, Schizothorax richardsonii, Labeoboga, Tor putitora, Schistura montanus. At Station II (Jhajjar kotli) 7 species were recorded (H=1.662) i.e. Labeo boga, To rputitora, Barilius vagra,Garragotyla, Puntius ticto, Bagarius yarrellii and Mastacembelus pancalus. 13 fish species were identified (H=1.959) at station III (Nagrota) which includes Barilius vagra, Puntius conchonius, Aspidoparia morar, Tor putitora, Crossocheilus latius, Garragotyla, Barilius bendelisis, Labeoboga, Puntiusticto, Schizothorax richardsonii, Labeobata, Puntius sophore and Nemacheilus botia. Whereas, station IV (Gujjar Nagar) was representated by 17 fish species (H=1.978) which includes Barilius vagra, Puntiu sconchonius, Puntiu sticto, Aspidoparia morar, Barilius bendelisis, Puntiu ssophore, Labeoboga, Crossocheilus latius, Labeodero, Garragotyla, Tor putitora, Nemacheilus botia, Mystus seenghala, Mastacembelus puncalus, Mastacembelus armatus, Channa punctatus and Channa striatus.
Moreover, a comparative study of various stations revealed that there was more abundance of cold water fishes in upstream sections (Station 1) whereas downstream section (station IV) showed more abundance of hardy warm water fishes. Similar abundance pattern of both cold and warm water fishes was also advocated by Sharma and Dutta(2010),while studying the ichthyofaunal diversity of river Basantar, an important tributary of river Ravi. Andotra (2014) in river Tawi and Gandotra and Poonam (2015) who also reported that there was more abundance of cold water fishes in upstream sections of Rajouri district whereas downstream sections showed more abundance of warm water and hardy fishes.
Further, during the present study fish diversity indices i.e. Shannon weiner (H) and Evenness (e) revealed that value of H and e was 1.286 & 0.7234, 1.662 & 0.753, 1.959 & 0.5454 and 1.978 & 0.4252 at stations I, II, III and IV respectively (Table 5& fig, 5). The result thus, clearly shows that maximum number of abundance and species diversity was found at station IV (downstream) and minimum at station I i.e. (upstream).The diversity indices of all the four longitudinal sections of river Tawi during present investigations shows inconsistency at all the study stations these variations may be due to variation in habitat and different conditions of selected sites such as food availability, primary production of plants and alga, bottom type depth, marginal vegetation, water current, substrate and temperature etc.Present findings are in line with other workers who also correlate rich diversity in downstream rivers with better food availability, breeding sites and water depth (Marais, 1988; Welcomme, 1985; Hina, 2010; Khajuria et al., 2013; Andotra, 2014; Samal et al,. 2016).
Table 5: Showing Fish species Richness, Abundance and diversityindices of four longitudinal sections of river Tawi.
| S.NO | Study Stations | Abundance (N) | Shannon- Weiner Index(H) | Simpsons Index of Dominance(D) | Margalefs Richness Index d=S-1/logN | Evenness IndexE=H´/log(S) |
| 1 | Chenani | 106 | 1.286 | 0.3418 | 0.8577 | 0.7234 |
| 2 | Jhajjar Kotli | 713 | 1.662 | 0.2013 | 0.9133 | 0.753 |
| 3 | Nagrota | 815 | 1.959 | 0.1817 | 0.79 | 0.5454 |
| 4 | Gujjar Nagar | 962 | 1.978 | 0.1997 | 2.329 | 0.4252 |
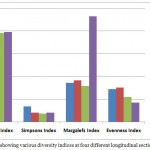 |
Figure 5: Graph showing various diversity indices at four different longitudinal sections of river Tawi.
|
Conclusion
The present study on diversity and abundance of Ichthyofauna at four different longitudinal sections of river Tawi, clearly discloses that all the study stations has ample number of fish species and variety which shows that habitat of river Tawi is conducive and can be used for aquaculture. The data also revealed that all the stream sections harbour food fishes and majority of them with some ornamental values. In order to conserve these valuable resources, a holistic approach integrating the concept of sustainable development and conservation measures should be adopted which will not only increase the economy but also provide employment to the rural folk.
Acknowledgements
Theauthors are thankful to University Grant Commission, New Delhi for financial assistance under UGC- SAP and H.O.D, department of Zoology University of Jammu.
References
- Andotra P. Impact of pollution on water quality and fishes of river Tawi. Ph.D. Thesis, University of Jammu, Jammu. 2014.
- Das S. M., Nath S. The icthyofauna of Jammu province (J&K). Kashmir Sci. 1966;2(1-2):65-78.
- Day F. The fishes of India being a natural history of the fishes known to inhabit the seas and fresh waters of India, Burma and Ceylon. Volume 1.University of California, Dawson Publisher. 1958.
- Dutta S. P. S., Malhotra Y. R. An upto date checklist and a key to identification of fishes of Jammu. Jammu Univ. Review. 1984;2:65-92.
- Dutta S. P. S., Gupta S. C., Salaria S. Icthyofaunistic survey of Rajouri District (J&K). 2002;3(2):201-205.
- Gandotra R., Sharma P. Study of Ichthyofaunal Diversity in a stream in sunderbani district Rajouri, Jammu (J&K). International Journal of Multidisciplinary Research and Development. 2015;2(9):401-404.
- Eco – biological studies of some freshwater ornamental fishes of Jammu. Ph.D Thesis, University of Jammu, Jammu. 2010.
- Jayaram K. C. The freshwater fishes of the Indian Region. Narendra Publishing House, Delhi. 1999;6:551.
- Jhingran V. G. Fish and Fisheries of India. Hindustan Publishing Corporation, India. 1991.
- Kar D., Nagarathna A. V., Ramachandra T. V., Day S. C. Fish diversity and conservation aspects in an aquatic ecosystem in NortheasternIndia. Zoos print journal. 2003;21(7):2308-2315.
CrossRef - Kaur S. Studies on the impact of tourism on stream Banganga and the indwelling macro and microorganisms. Ph.D.Thesis, University of Jammu, Jammu. 2006.
- Khajuria B., Langer S., Tripathi N. K. Status of Golden Mahseer (Tor putitora) in Jammu region (J&K).International Journal of Recent Scientific Research. 2013;4(7):1154-1156.
- Marais J. F. K. Some factors that influence fish abundance in South African estuaries. Afr. J. Marine Sci. 1988;6:67-77.
CrossRef - Margalef R. Perspective in ecological theory, University of Chicago. 1958;112.
- Mishra A., Raut D., Patnaik L. Fisheries and hydrography of Baitarini at Jajpur, Odisha East coast of India.International Journal of Scientific and Research Publications. 2013;3(6):2250-3153.
- Pielou E. C. The measurement of diversity in different types of biological collections
- J theor. Bid . 1966;13:131-114.
- Razak A., Mohamed M. K.,Younis K. H., Hameed E. Status of fish Assamblage structure in the Garmat Ali River,Iraq.(IOSR-JAVS). 2017;17(22)
- Samal D., Sethy J., Sah H. K. Ichthyofauna diversity in relation to physico-chemical characteristics of Budhabalanga River, Odisha. International Journal of Fisheries and Aquatic Studies. 2016;4(1):405-413.
- Shanno C. E., Weaver W. The mathematical theory of communication, University Illinois Press, Urbana, IL. 1949; 117.
- Sharma A., Dutta S. P. S. Present and past status of fish fauna of river Basanter, an important tributary of the river Ravi, in Samba district, Jammu (J&K).Journal of Applied and Natural Sciences. 2010;4(1):123-126.
- Simpson E. H. Measurement of Diversity, Nature, Lond. 1949;163-188.
- Talwar P. K., Jhingran A. G. Inland fishes of India and adjacent countries. Oxford & IBH Publishing Co., New Delhi, Bombay & Calcutta. 1991;1(2):1-1158.
- Impact of aquatic environment on the biology of some minor carps inhabiting river Tawi.Ph.D. Thesis, University of Jammu, Jammu. 2016.
- Welcomme R. L. River fisheries. FAO Fish Tech Pap. 1985;262:1–318.

This work is licensed under a Creative Commons Attribution 4.0 International License.


